
This is another Arduino-based project that studies the effects of different parameters on cooling of water. A DS18B20 waterproof temperature sensor was used to monitor the temperature of hot water that was allowed to cool. This sensor collects the temperature of cooling water in every ten seconds. The various parameters that are considered for this study are; room temperature, mug size, and mug material. Using arduino-based temperature monitoring, this article investigates the influence of these parameters on cooling.
Rosemary Salin, Cademix Institute of Technology
Introduction
Arduino is an electronics platform that is free to use. Arduino-based projects have achieved significant popularity because of their ease of use and low cost. This open-source microelectronics has two important characteristics: the hardware costs less than typical devices, and the software is free. Moreover, it is a beginner-friendly platform. This is also an Arduino-based project. The aim of this project is to examine the effect of different parameters on cooling of water. It studies how the size of the mug, room temperature, and material of the mug affect the cooling. In this project, I use a DS18B20 temperature sensor to measure the temperature of the water. These temperature readings helps to understand the effect of different parameters on cooling.
Materials Required
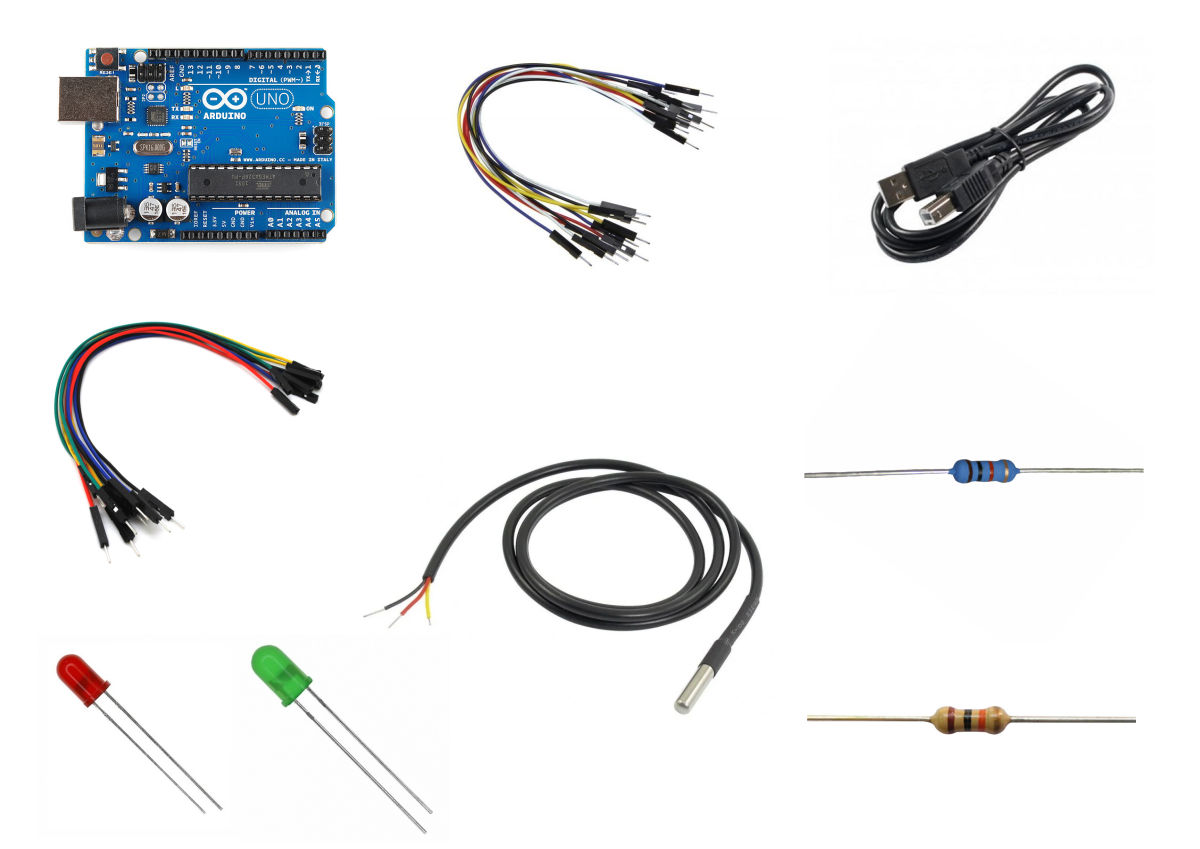
Components required to build the Arduino circuit
To begin temperature monitoring, we must first connect the Arduino. It requires a set of components. You can see the list of these components below.
- Arduino UNO board
The Arduino UNO board is used as the microcontroller board. It is based on the ATmega328P microcontroller. Moreover, it is a low-cost, versatile, and simple-to-use microcontroller board that may be used in a range of electronic applications. - DS18B20 Waterproof temperature sensor
The DS18B20 temperature sensor is a one-wire digital temperature sensor. This implies that communicating with the Arduino just requires one data line (and GND). The sensors have a claimed accuracy of ±0.5 degrees Celsius in the temperature range of -10 to +85 degrees Celsius. However, it can measure temperatures ranging from -55°C to +125°C. It has three wires. The black wire acts as the ground pin (GND), while the red wire gives power to the sensor, which can range from 3.3 to 5V. (VDD). The yellow cable, on the other hand, is the 1-Wire Data Pin. - Breadboard
- Male to male jumper wires
- Male to female jumper wires
- USB Cable
- 10K ohm resistor
- 220 ohm resistor
- Green and Red LEDs
Other Materials Required to Study the Effect of Various Parameters on Cooling of Water
In addition to the above list of materials, we need different mugs for performing this project. In order to study the effect of mug size on cooling, we use steel mugs of three different sizes. Similarly, for studying the effect of material of the mug on cooling, we use a steel mug and a glass mug.
Experimental
The experimental part of this project have three subsections. Firstly, we have to build the Arduino circuit for temperature monitoring. Secondly, we have to generate the Arduino sketch (code) in Arduino IDE software. Finally, there is the collection of temperature readings of cooling water for different room temperatures, mug sizes, and mug types.
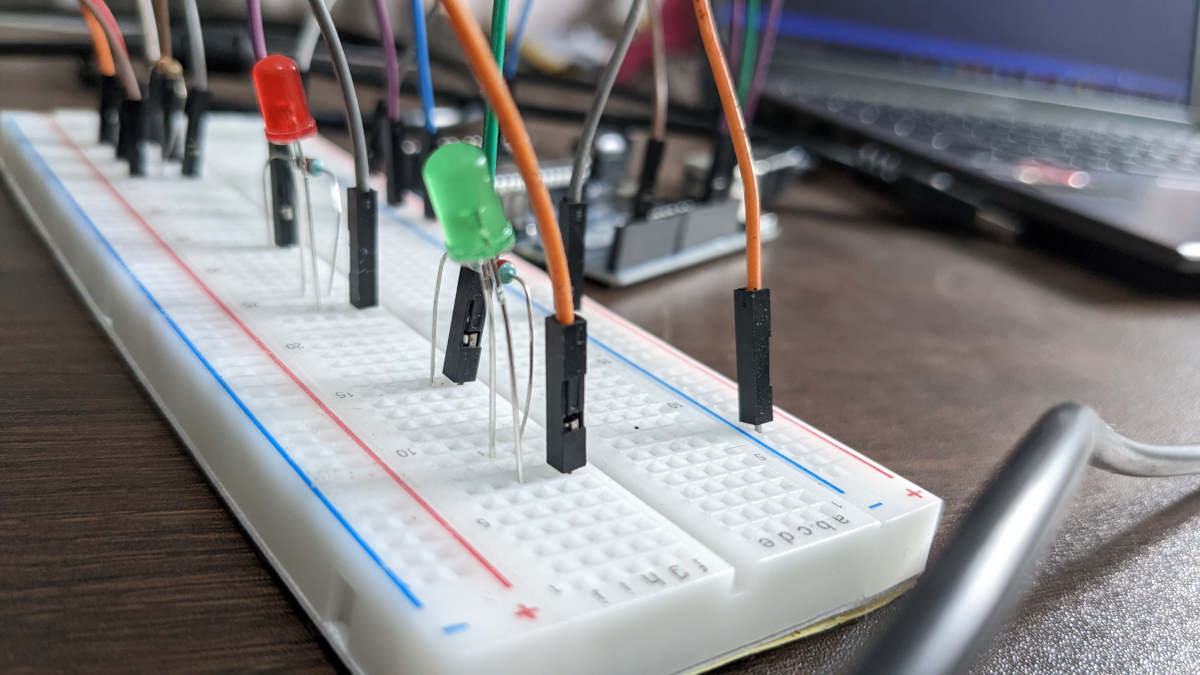
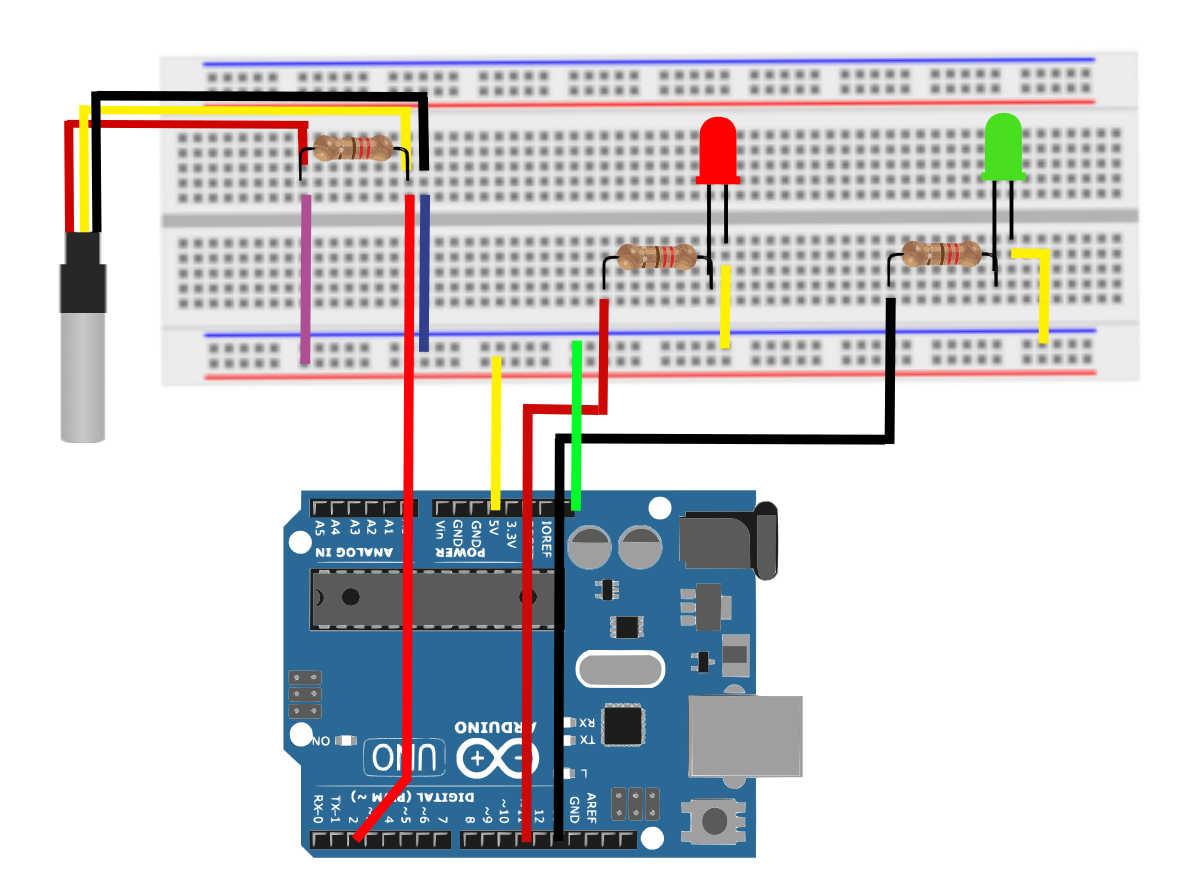
Arduino Circuit for Temperature Monitoring
The Arduino circuit is exactly the same as shown in the schematic circuit diagram. As mentioned earlier, DS18B20 waterproof temperature sensor is used for temperature monitoring. So, we are starting the circuit connections by connecting the sensor to Arduino. Firstly, connect the red wire (VDD) of the sensor to the 5V out pin on the Arduino board. Then connect the black wire (GND) to ground. Subsequently, connect the yellow wire (one wire data pin) to digital pin 2 of Arduino UNO. Remember o include a 4.7K ohm or 10K ohm pull-up resistor between yellow wire and red wire. In fact, we can simply use this circuit for temperature monitoring. However, I included a red and green LEDs as an alert system. The connections for LEDs are also the same as shown in the schematic circuit diagram.
You can see more details about the pull-up resistors and the LED connections from my previous project Verification of Newton’s Law of Cooling Using Arduino.
Arduino Sketch
A sketch is the name Arduino uses for programming. When you start programming, you should have DallasTemperature.h and OneWire.h libraries installed. Given below is the Arduino sketch for this project. If you want to get the code with explanation check my previous project Verification of Newton’s Law of Cooling Using Arduino.
#include <OneWire.h>
#include <DallasTemperature.h>
#define ONE_WIRE_BUS 2
OneWire oneWire(ONE_WIRE_BUS);

DallasTemperature sensors(&oneWire);
Void setup
Next part of the sketch is the void setup. This function includes commands that will run only once.
void setup() {

  Serial.begin (9600);
  sensors.begin();
  Serial.print ("Temperature ");
  Serial.print ((char)176);
  Serial.println ("C");

}
Void loop
Third part of the sketch is void loop. The code after the opening curly bracket ({) of this function will run repeatedly until the curly bracket of this function is closed.
void loop() {

  int T = 40;
  int redPin = 12;
  int greenPin = 13;
  int delayTime = 10000;
  sensors.requestTemperatures();
  Serial.println(sensors.getTempCByIndex(0));
If function
Inside the void loop function there is a set of if functions for controlling the LEDs. According to the code, if the temperature is greater than or equal to 40 oC, the red LED should be on and the green LED should be off. If the temperature is less than 40 oC, the green LED should be on and the red LED should be off. Let us see the code for this.
if (sensors.getTempCByIndex(0)>=T){
digitalWrite(redPin,HIGH);
}
if (sensors.getTempCByIndex(0)<T){
digitalWrite(redPin,LOW);
}
if (sensors.getTempCByIndex(0)<T){
digitalWrite(greenPin,HIGH);
}
if (sensors.getTempCByIndex(0)>=T){
digitalWrite(greenPin,LOW);
}
delay(delayTime);
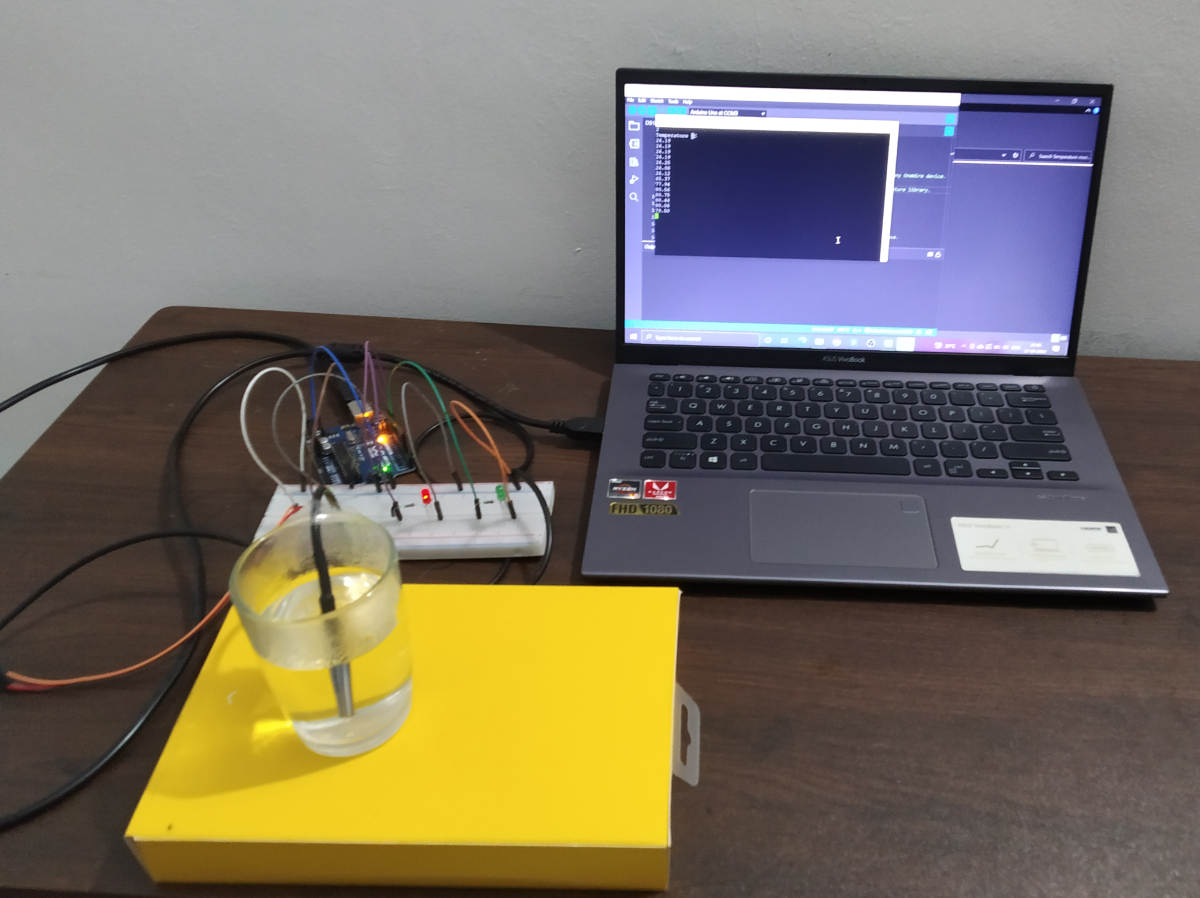
}Method for Studying the Effect of Various Parameters on Cooling of Water
After building the circuit and creating the sketch, next step is the temperature monitoring. In order to take temperature readings, first step is to place a mug over an insulating material. Then we have to tape the sensor to the mug. The next step is connecting the microcontroller board to the computer using a USB cable. You can see a LED light on the Arduino UNO board after connecting it to the computer. Now we have to upload the Arduino sketch to the board. Thus you will get room temperature readings in every 10 seconds. Finally, pour some boiled water (~150 mL) to the mug and record the temperature readings.
The experimental setup for examining the influence of room temperature on water cooling is the same as described previously. We take temperature readings using a steel cup. The following room temperatures are measured: 24.19 oC, 27.31 oC, 30.44 oC, and 32.50 oC.
Similarly, for investigating how size of the mug affects cooling of water, we use three different sized mugs. The temperature readings for water taken in small, medium, and a large sized mugs are recorded. These readings are taken when the room temperature is 28.19 oC.
Finally, a glass mug and a steel mug are used to study the effect of material of mug on cooling of water. In this case, the readings are taken when the room temperature is 26.12 oC.
Results and Discussion
Temperature-Time graph is plotted using the data obtained. In addition, the equation for Newton’s law of cooling is used to compare the effect of different parameters. The equation for Newton’s law of cooling is:
Tbody – Tsurr = C e-Kt ……………………………………………………………………………………………………….(1)
Let us see how room temperature, mug size, and material of mug affect cooling of water.
Effect of Room Temperature on Cooling of Water
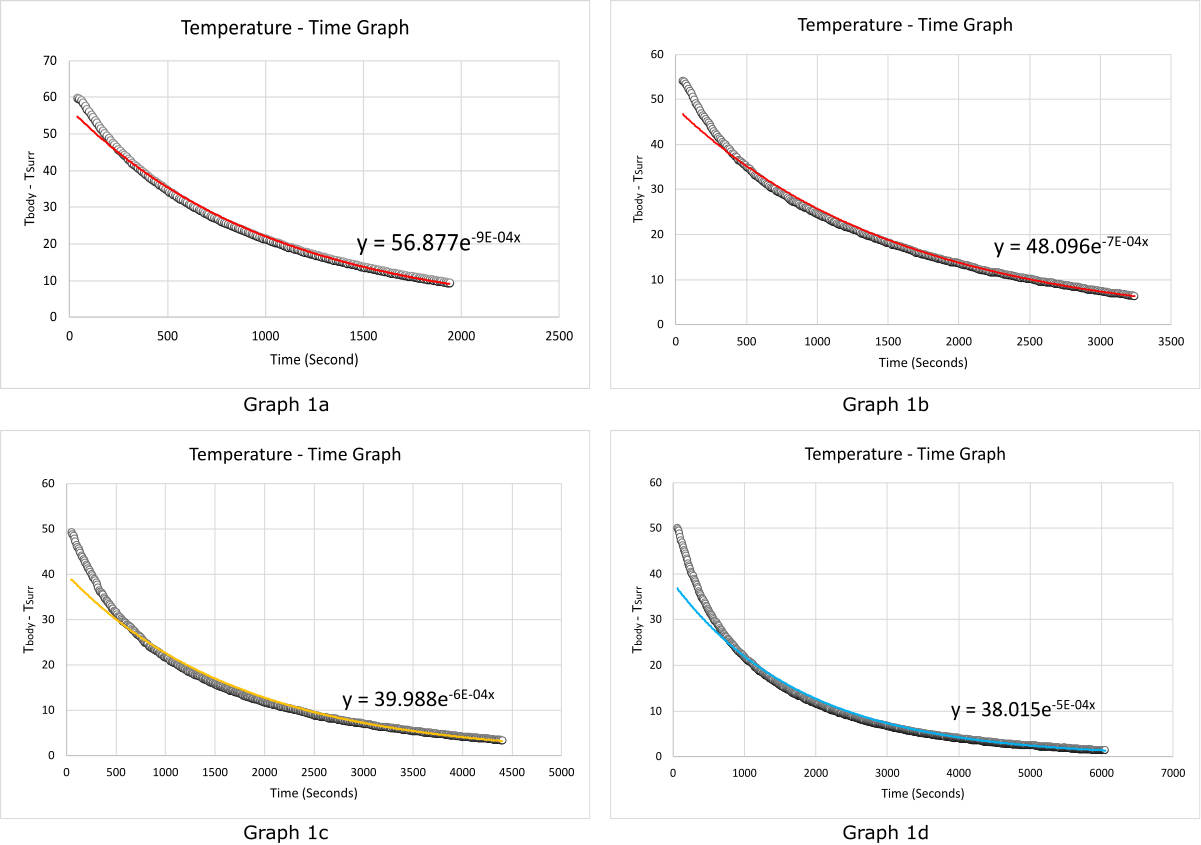
Graph 1a: Room temperature = 24.19 oC, Graph 1b: Room temperature = 27.31 oC, Graph 1c: Room temperature = 30.44 oC, Graph 1d: Room temperature = 32.50 oC
Since there are temperature readings for four different room temperatures, there are four graphs and their corresponding equations. We can see that the time taken for the water to cool down to 34 oC is different for different room temperatures. When the room temperature was 24.19 oC, the water was cooled down to 34 oC in 1900 seconds. However, when the room temperature was 27.31 oC, it took around 3200 seconds for the water to drop down to 34 oC. Similarly, when the room temperature was 30.44 and 32.50 oC, the water took 4360 and 6040 seconds to cool down to 34 oC, respectively. This data shows that when the room temperature is low, the cooling rate is high.
In addition, we will get the K (cooling constant) and C (constant) values for different conditions from the equations for the Temperature- Time graphs. Let us see the equations of these four graphs.
The equation for the Graph 1a is:
y = 56.877e-9E-04x ……………………………………………………………………………………………………………………(2)
The equation for the Graph 1b is:
y = 48.096e-7E-04x ……………………………………………………………………………………………………………………(3)
The equation for the Graph 1c is:
y = 39.988e-6E-04x ……………………………………………………………………………………………………………………(4)
The equation for the Graph 1d is:
y = 38.015e-5E-04x ……………………………………………………………………………………………………………………(5)
Comparing these equations with equation (1), we get that the cooling constants are 0.0009, 0.0007, 0.0006 and 0.0005 for room temperatures 24.19, 27.31, 30.44, and 32.5 oC, respectively. Here also you can see that the cooling constant is high for lower room temperature.
Effect of Mug Size on Cooling of Water
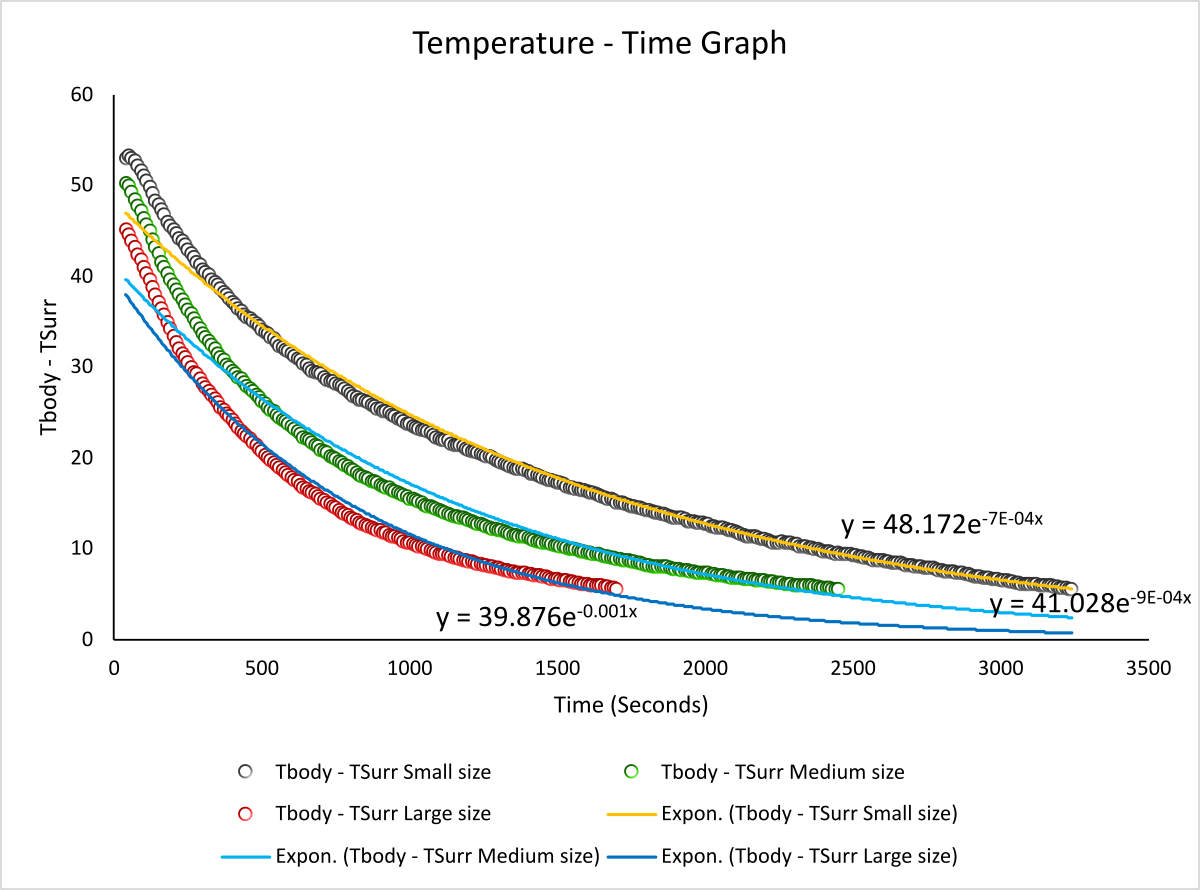
Graph 2 depicts the effect of mug size on cooling of water. The room temperature was 28.19 oC. We can see that within 1700 seconds the water in the large mug cooled down to 33.81 oC. However, the water in the medium-sized cup took 2450 seconds to drop down to 33.81 oC, whereas the water in the small mug took 3240 seconds. As a result, it is evident that as the size of the mug increases, so does the cooling rate.
Moreover, comparing the equation (1) with the equations for curves in Graph 2 gives the K values for small, medium, and large-sized mugs as 0.0007, 0.0009, and 0.001, respectively. This demonstrates that when mug size increases, K value increases, implying that cooling rate increases as well. That is, effect of mug size and cooling rate are directly proportional to each other.
Effect of Material of Mug on Cooling of Water
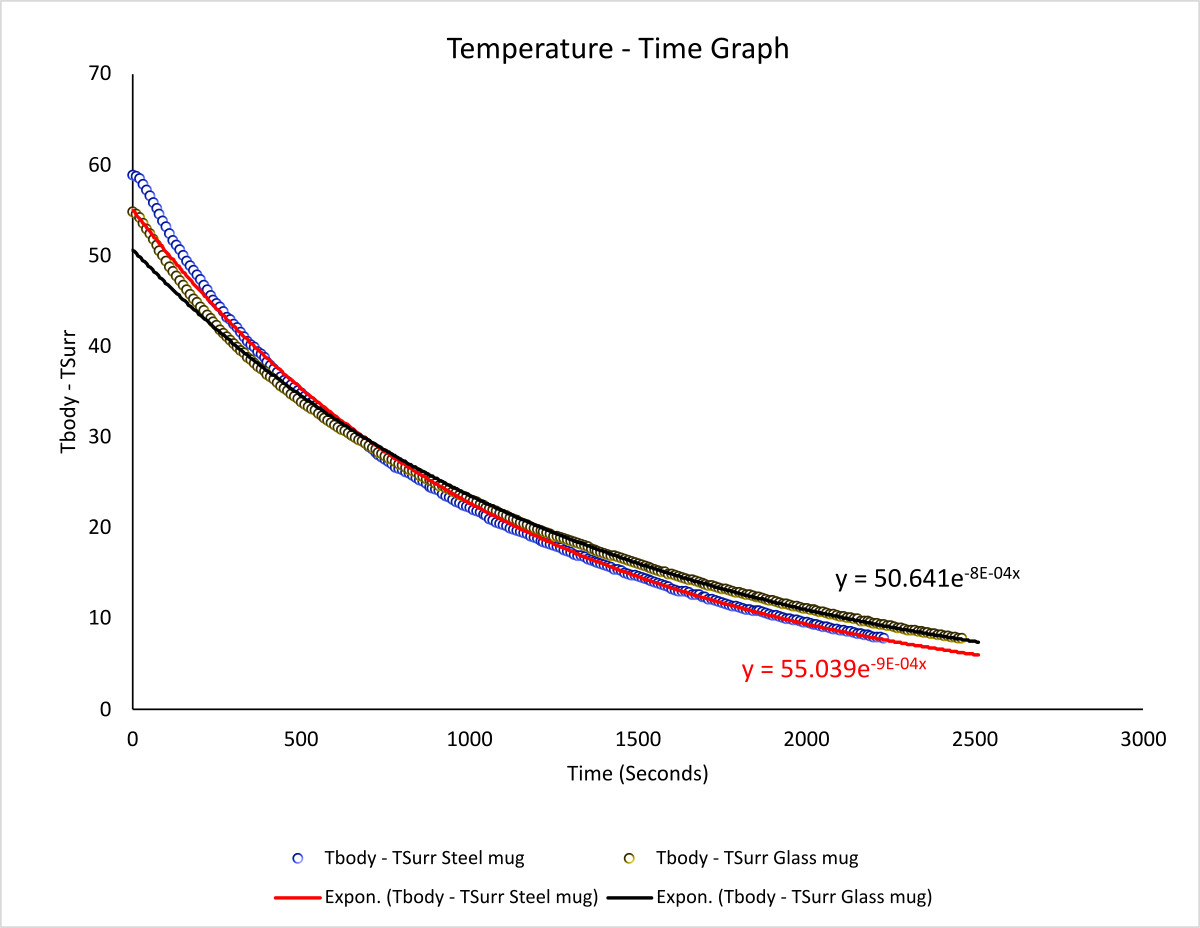
Graph 3 depicts the effect of mug size on cooling of water. The temperature in the room was 26.12 degrees Celsius. The effect was studied using a glass mug and a steel mug. We can see that the water in the steel cup cooled down to 33.88 C after 2280 seconds. However, it took 2510 seconds for the water in the glass cup to cool to 33.88 degrees Celsius. That is, water in a steel mug cools faster than water in a glass mug. As a result, it is clear that the material of the mug influences the rate of cooling. We know that steel has a higher thermal conductivity than glass. Moreover, the K values obtained from the curves are 0.0009 and 0.0008 for steel and glass mug, respectively. Hence, the collected data indicates that the cooling rate is proportional to their thermal conductivity.
So we have seen the effect of various parameters on cooling of water. The data obtained from all of these Temperature-Time graphs are summarised in the table given below.
| Parameters | K | C | |
|---|---|---|---|
| Mug Size | Small | 0.0007 | 48.172 |
| Medium | 0.0009 | 41.028 | |
| Large | 0.001 | 39.876 | |
| Room Temperature (Degree Celsius) | 24.19 | 0.0009 | 56.877 |
| 27.31 | 0.0007 | 48.096 | |
| 30.44 | 0.0006 | 39.988 | |
| 32.50 | 0.0005 | 38.015 | |
| Material of mug | Steel | 0.0009 | 50.641 |
| Glass | 0.0008 | 55.039 | |
Conclusion
In this project, Arduino UNO microcontroller and the DS18B20 temperature sensor are used to collect temperature readings. The role of room temperature, mug size, and mug material on water cooling is examined using these measurements. Indeed, the Temperature – Time graphs demonstrate the influence of various factors on cooling. Furthermore, we compared the findings using Newton’s law of cooling equation. As a result, we determined the K and C values under various conditions. Accordingly, we observed that as the size of the mug increases, so does the cooling rate. Similarly, the cooling rate is directly proportional to the thermal conductivity of the mug’s material. However, when the room temperature increases, the rate of cooling decreases. Hence, this Arduino project studied the effect of different parameters on cooling of water.

About the Author
Rosemary Salin is an Associate Chemist at Cademix Institute of Technology, Austria with a Master of Science in Chemistry. Her interests include studying scientific problems and finding different solutions to them through experiments.
Furthermore, she was a recipient of the INSPIRE (Innovation in Science Pursuit for Inspired Research) Scholarship from 2016 to 2021. It is a scholarship program implemented by the Department of Science and Technology (DST), Government of India. It is given to deserving students doing bachelor’s and master’s courses in Natural and Basic Sciences. Moreover, she is a member of the Cademix Career Autopilot Program. She is available for new opportunities. Please feel free to contact her.
E-mails:
rosemary.salin@cademix.org
rosemarysalin99@gmail.com
LinkedIn:
Rosemary Salin is an Associate Chemist at Cademix Institute of Technology, Austria with a Master of Science in Chemistry. Her interests include studying scientific problems and finding different solutions to them through experiments.
Furthermore, she was a recipient of the INSPIRE (Innovation in Science Pursuit for Inspired Research) Scholarship from 2016 to 2021. It is a scholarship program implemented by the Department of Science and Technology (DST), Government of India. It is given to deserving students doing bachelor’s and master’s courses in Natural and Basic Sciences. Moreover, she is a member of the Cademix Career Autopilot Program. She is available for new opportunities. Please feel free to contact her.
E-mails:
rosemary.salin@cademix.org
rosemarysalin99@gmail.com
Linkedin:
https://www.linkedin.com/in/rosemary-salin/
Related Keywords
Arduino, Arduino UNO, Breadboard, Newton’s law of cooling, Thermal conductivity, Rate of cooling, Cooling constant, DS18B20 temperature sensor, Resistors, Light emitting diode (LED), Exponential decay, Dallas Temperature library, One Wire library, Digital pin, Analog pin, Digital input, Analog input, Arduino ide, Arduino sketch, Arduino programming language, void setup, void loop, if function.
Power-supply, Programming, Arduino software, USB-port, Male to Male jumper wires, Male to female jumper wires, Digital temperature sensor, sensors, Output pin, Input pin, Voltage common collector (VCC), Ground (GND), C programming, Serial port, Digital sensor, Analog sensor, Arduino compatible sensor.