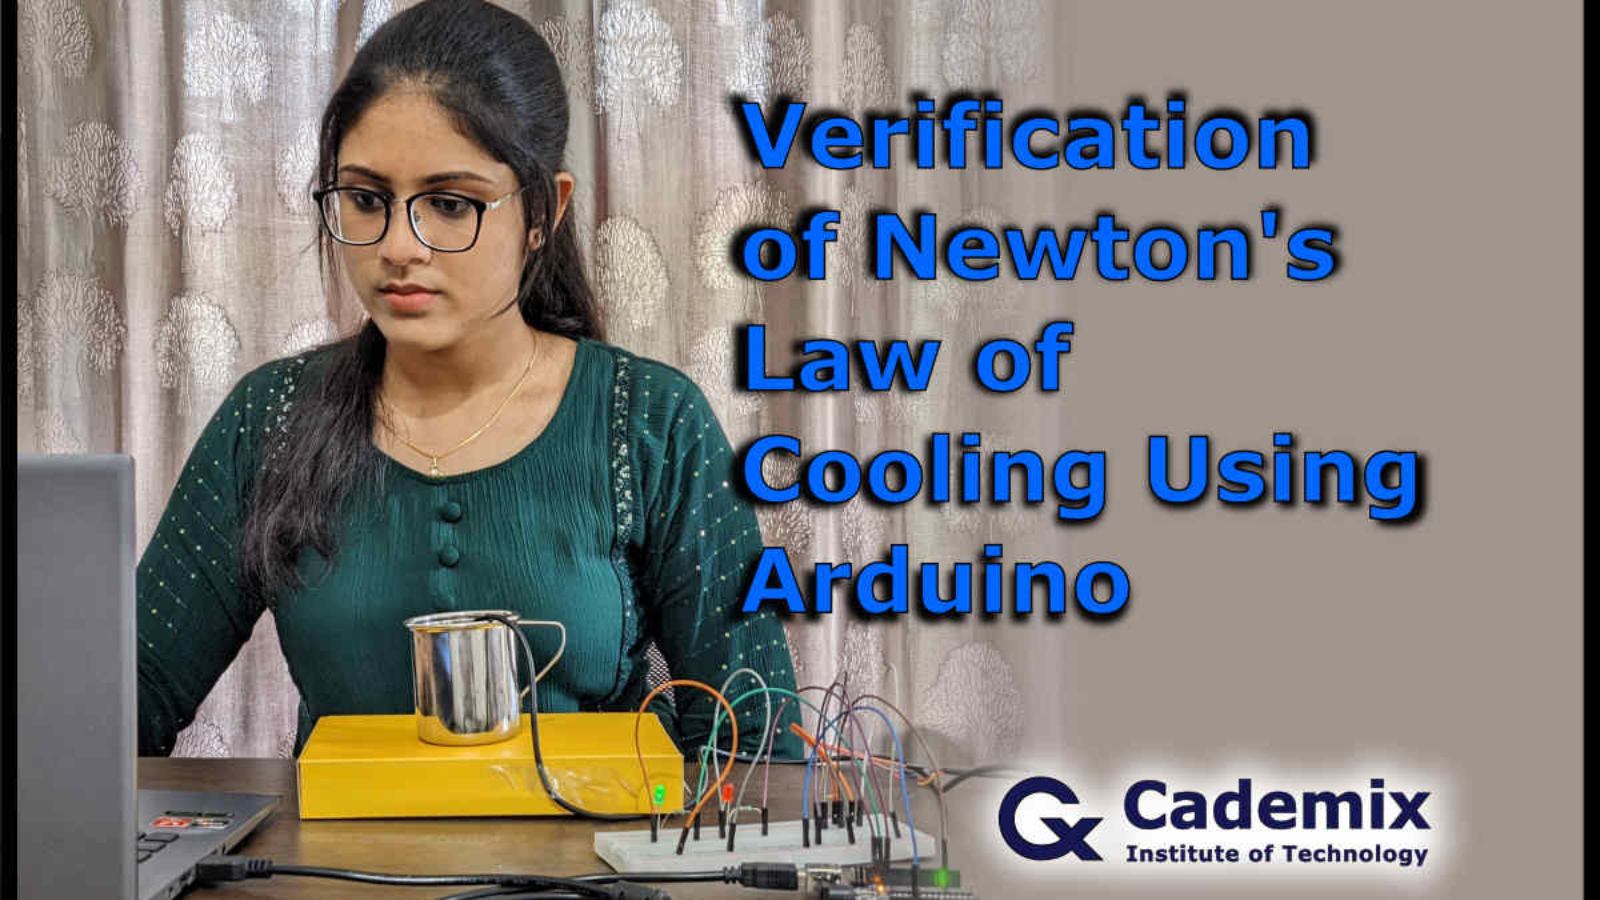
The Arduino platform is a free and open source electronics platform. Due to their ease of use and inexpensive cost, Arduino-based projects have gained widespread recognition. This is also an Arduino-based project that examines Newton’s law of cooling. A DS18B20 waterproof temperature sensor was used for temperature monitoring. Newton’s law of cooling was validated by using temperature data. This article will discuss the Newton’s law of cooling and serve as a guide for verifying it with an Arduino. In fact, the main focus of the article is the experimental setup for arduino-based temperature monitoring and the verification of the law.
Rosemary Salin, Cademix Institute of Technology
Introduction
Arduino has already acquired wide appeal among both students and professionals. The main reason for this is the ease of usage and low cost of the Arduino. As a result, a huge number of projects have been done using arduino. This project is done as a part of Cademix Career Autopilot Program. Moreover, it is my first project using arduino. In this project, Newton’s law of cooling was verified using arduino uno and DS18B20 temperature sensor.
We all know that placing hot water or tea on a table causes it to gradually cool. It finally approaches the ambient temperature. In the 17th century, Isaac Newton developed his novel Law of Cooling. According to this law, the rate of cooling of a body is proportional to the temperature difference between the body and its surroundings. In numerous situations, Newton’s Law of Cooling can be used. Forensic scientists, for example, can use this law to find out the time of death of a person. They will measure the temperature of the body as well as the room temperatures. After that, they compute the cooling time using Newton’s Law of Cooling.
Newton’s Law of Cooling
We have already discussed newton’s law of cooling in the introduction. However, let us discuss a bit more details here. In fact, Newton was the first to conduct a systematic analysis of the link between the heat lost by a body in a certain container and its temperature. According to Newton’s law of cooling, the rate of heat loss from a body is directly proportional to the temperature difference between the body and its surroundings. Let us see the mathematical expression for this statement. Suppose that the temperature of the body at a time ‘t’ is ‘Tbody‘. Similarly, the temperature of the surroundings is ‘Tsurr‘. Then the mathematical expression for newton’s law of cooling is,
loge (Tbody – Tsurr) = -Kt + c …………………………………………………………………………….(1)
or
Tbody – Tsurr = C e-Kt ……………………………………………………………………………..(2)
Where K is cooling constant. Furthermore, C is a constant which is equivalent to the difference in temperature of the body at t=0 and the surrounding temperature. As already mentioned, in this article you will see the verification of newton’s law of cooling using arduino. First of all, let us see the materials required for this project.
Materials Required for the Verification of Newton’s Law of Cooling Using Arduino
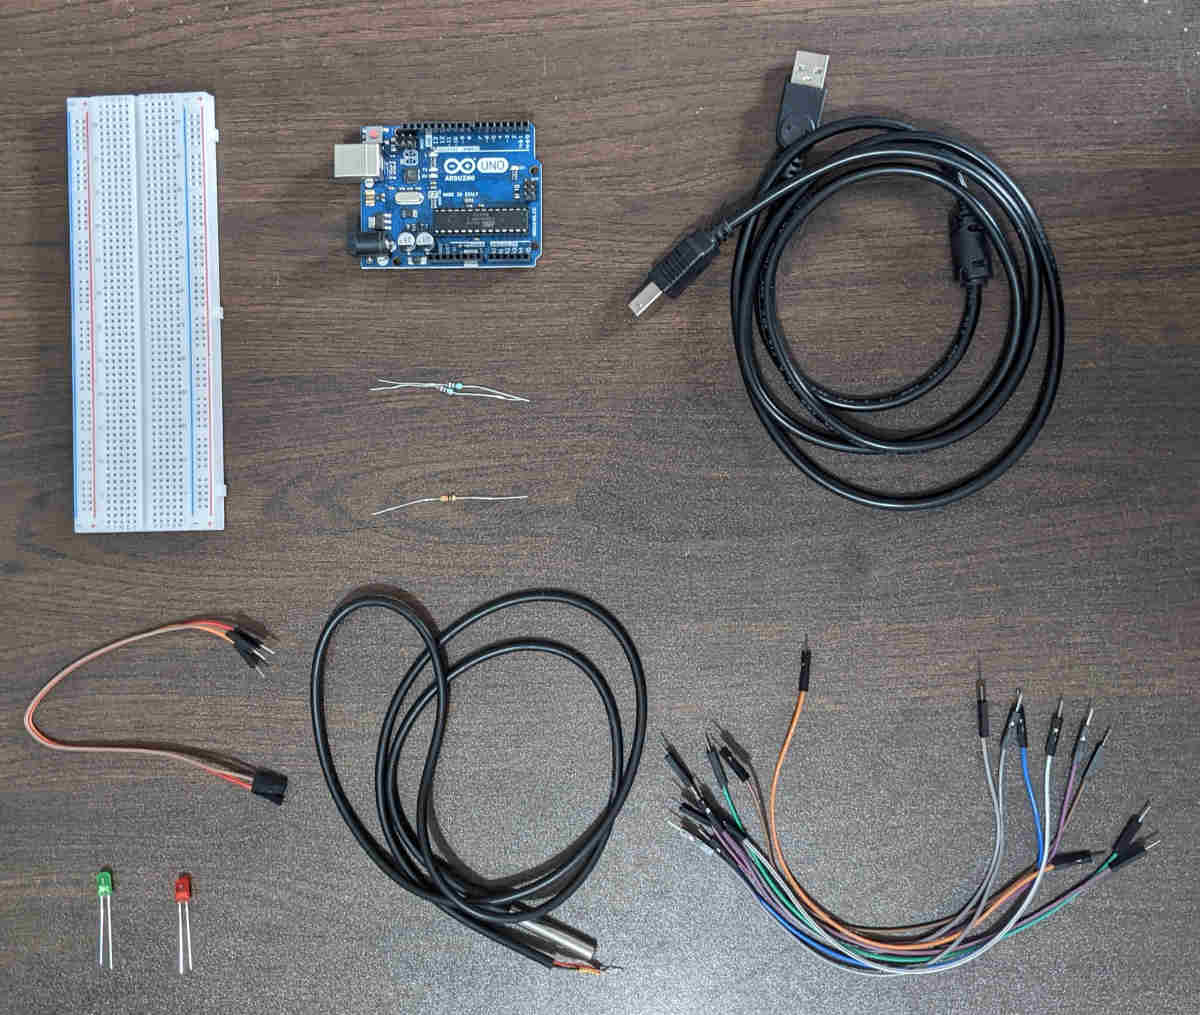
- Arduino UNO
Arduino UNO board was used as the microcontroller board. It is highly user-friendly while also providing outstanding connectivity. As a result, it is one of the best Arduino boards for beginners. It is based on the Microchip ATmega328P microcontroller. The board has both digital and analogue input/output (I/O) pins. It may be powered through USB or an extra 9-volt battery. - DS18B20 Waterproof temperature sensor
In this project DS18B20 waterproof temperature sensor is used for temperature monitoring. It is a 1-wire programmable Temperature sensor. It can measure a wide range of temperature from -55°C to +125°C. Furthermore, it has an accuracy of ±0.5°C Accuracy from -10°C to +85°C. It has three wires. The black wire is the ground pin (GND). The red wire is the pin that supplies power for the sensor which can be between 3.3 to 5V (VDD). Whereas, the yellow wire is the 1-Wire Data pin. - USB Cable
A USB cable connects the Arduino UNO board to the computer. - Breadboard
- 10K ohm resistor
- 220 ohm resistor
- Green and Red LEDs
- Male to male jumper wires
- Male to female jumper wires
- Steel mug
Experimental
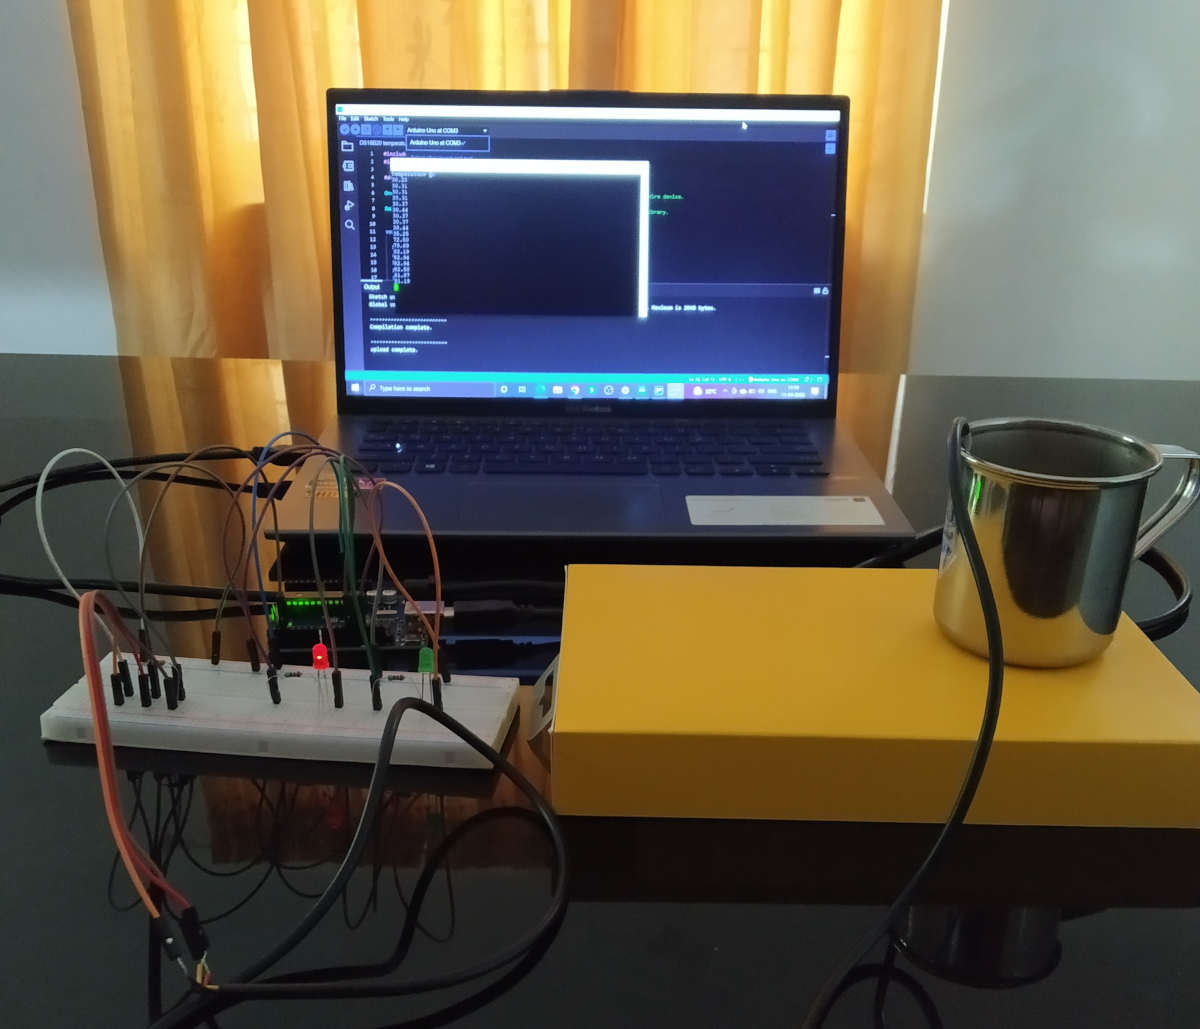
The experimental section has three parts. The first is the circuit connections. It is then followed by the Arduino sketch or coding part. Finally, there is the temperature monitoring using which we will verify Newton’s law of cooling. I have uploaded a detailed video explaining the circuit connections and the experimental section. Please check the video for getting more clarification about the experimental section.
Circuit and Wiring
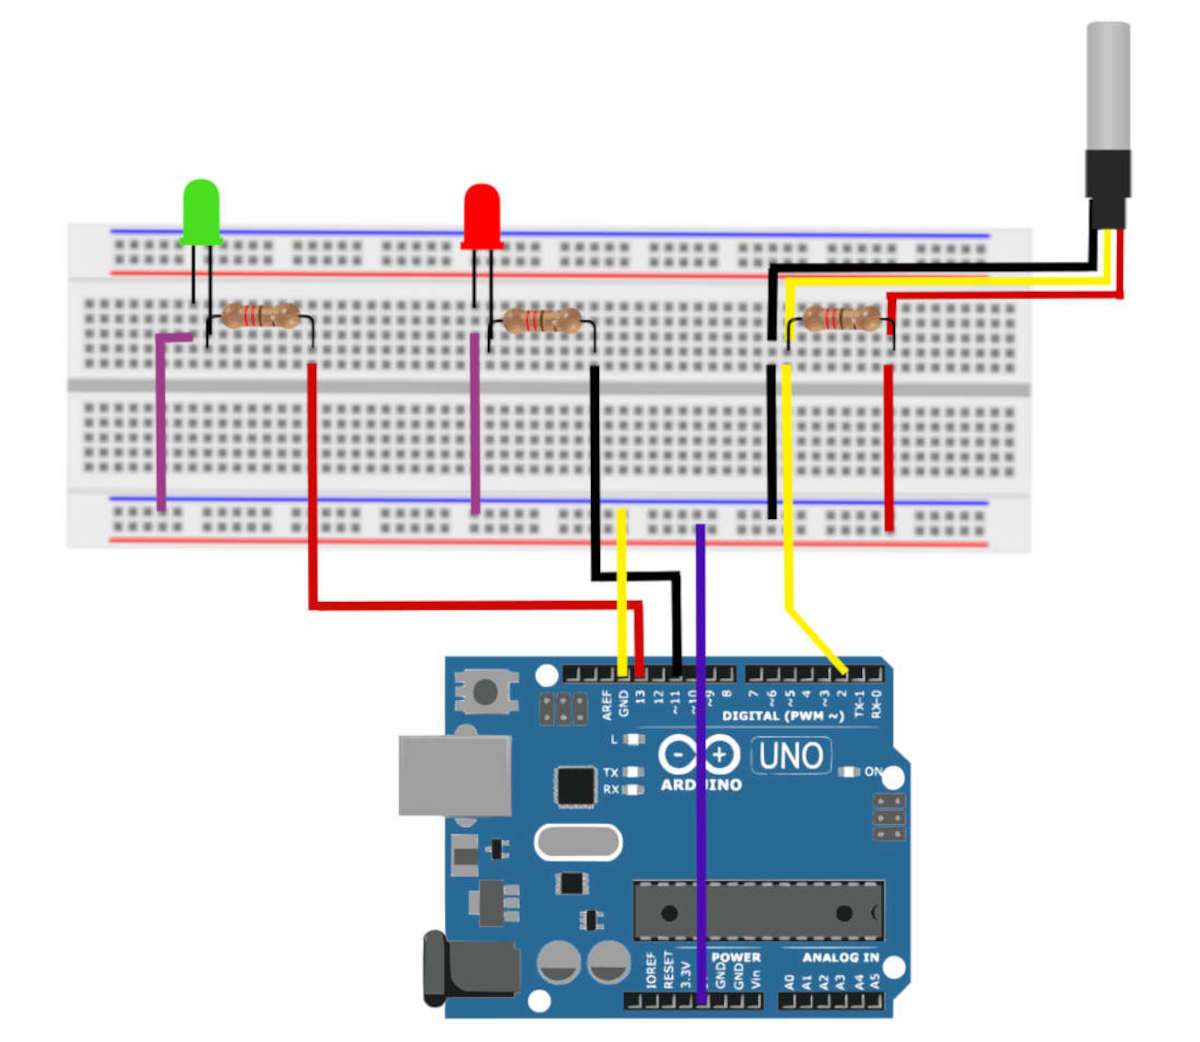
The circuit connections are exactly the same as shown in the schematic circuit design. It is fairly simple to connect the DS18B20 Temperature Sensor to the Arduino. Start by connecting red wire (VDD) of the sensor to the 5V out pin on the Arduino and black wire (GND) to ground. Then, connect the remaining digital signal pin DQ to arduino’s digital pin 2. You’ll also need to connect a pull-up resistor between the signal and power pins to make the data transfer steady. It is preferable to use a 4.7K ohm resistor for this purpose. If you don’t have one, a 10K ohm resistor would work. In fact, I used a 10K ohm resistor. These connections are enough for temperature monitoring.
However, in my project, I utilised a red LED and a green LED as an alert system. Connect the short leg (negative leg) of the red LED to the arduino’s ground. Connect the positive leg to digital pin 12. You can use any of the other digital pins and alter the code accordingly. You should put a resistor between the positive leg of the LED and the Arduino’s digital output pin. Its purpose is to prevent LEDs from burning due to high voltage. Similarly, connect the negative leg of the green LED to the Arduino’s ground and the positive leg to digital pin 13. Remember to include a resistor. I used a 220 ohm resistor. Let’s move on to the programming part.
Arduino Sketch
A sketch is the name Arduino uses for programming. Before you begin programming, you should have two libraries installed: DallasTemperature.h and OneWire.h. The Dallas 1-Wire protocol is a little complicated. In order to cover this additional complexity, we’ll install the DallasTemperature.h library, which will allow us to give simple commands to obtain temperature values from the sensor. Moreover, Dallas Temperature is a hardware-specific library that handles lower-level functions. As a result, to communicate with any one-wire device, it must be associated with One Wire Library.
Given below is the sketch for this project. Along with the code you can see short comments starting with //. These comments will help you to understand the code. They are the explanations for the corresponding command. However, if you have any questions about the sketch or the project as a whole, feel free to contact me.
Firstly, IDE will give commands to include onewire and Dallas libraries. Then create the instances to communicate with the onewire device.
#include <OneWire.h>
#include <DallasTemperature.h>

#define ONE_WIRE_BUS 2  // Data wire is connected to digital pin 2 of arduino.

OneWire oneWire(ONE_WIRE_BUS);   // Setup a oneWire instance to communicate with any OneWire device.

DallasTemperature sensors(&oneWire);    // Pass oneWire reference to DallasTemperature library.
Void setup
Next part of the code is the void setup. The commands that are given in this function will run only once. So, I have given a command to print “Temperature o C” only once.
void setup() {

  Serial.begin (9600);
  sensors.begin();     // Starup the library.
  Serial.print ("Temperature ");     // Print Temperature [Degree Celsius] only once.
  Serial.print ((char)176);    // Print degrees character.
  Serial.println ("C");     // Print C.

}
Void loop
Third function in the code is the void loop. As the name indicates, the code in this function will run over and over as long as the Arduino Board is turned on. Actually, this is the main part of the sketch. This function includes the code for temperature monitoring and printing.
void loop() {

  int T = 40;
  int redPin = 12;   // Red LED is connected to pin 12 of arduino.
  int greenPin = 13;  // Green LED is connected to pin 13 of arduino.
  int delayTime = 10000;    // delayTime is 10000 milliseconds and it is a local variable.
  sensors.requestTemperatures();   // Send the command to get temperatures.
  Serial.println(sensors.getTempCByIndex(0));    // Print the Celsius temperature.
If function
The commands that are given so far are enough for temperature monitoring. But, you can see that I have not closed the void loop function with the curly bracket. It is because I’m including an if function to control the LEDs. More explanation about if function is given in the sketch and in the video.
if (sensors.getTempCByIndex(0)>=T){
  digitalWrite(redPin,HIGH);  // Turn on red LED when the temperature is greater than or equal to T.
}
if (sensors.getTempCByIndex(0)<T){
  digitalWrite(redPin,LOW);  // Turn off red LED when the temperature is less than T.
}

if (sensors.getTempCByIndex(0)<T){
  digitalWrite(greenPin,HIGH);  // Turn on green LED when the temperature is lesser than T.
}
if (sensors.getTempCByIndex(0)>=T){
  digitalWrite(greenPin,LOW);  // Turn off green LED when the temperature is greater than or equal to T.
}

delay(delayTime);  // Repeat the commands in void loop after delayTime.

}
Temperature Monitoring Using Arduino
Firstly, we have to place the steel mug over an insulating substance. Next step is taping the sensor to the mug for stable temperature monitoring. Thus, the temperature monitoring setup is complete. Finally, we have to connect the Arduino UNO board to the computer using a USB cable. The next step is to upload the code to the Arduino board. As a result, the sensor will provide temperature values. Then, approximately 150 mL of hot water is poured to the mug. Consequently, the temperature readings will be high. The temperature readings are taken in every 10 seconds until it reached 33 degrees Celsius.
Results and Discussion
Graphical Verification of Newton’s Law of Cooling
The temperature of water was measured in degree celsius (oC). Initially, it was 83.5 oC and the room temperature was 26.25 oC. The water was cooled to 33 oC in 2890 seconds (48.167 minutes). Using these readings, a graph was plotted with time along x-axis and Tbody-Tsurr along y-axis. According to the previously described equation (2), this graph should be an exponential decay.
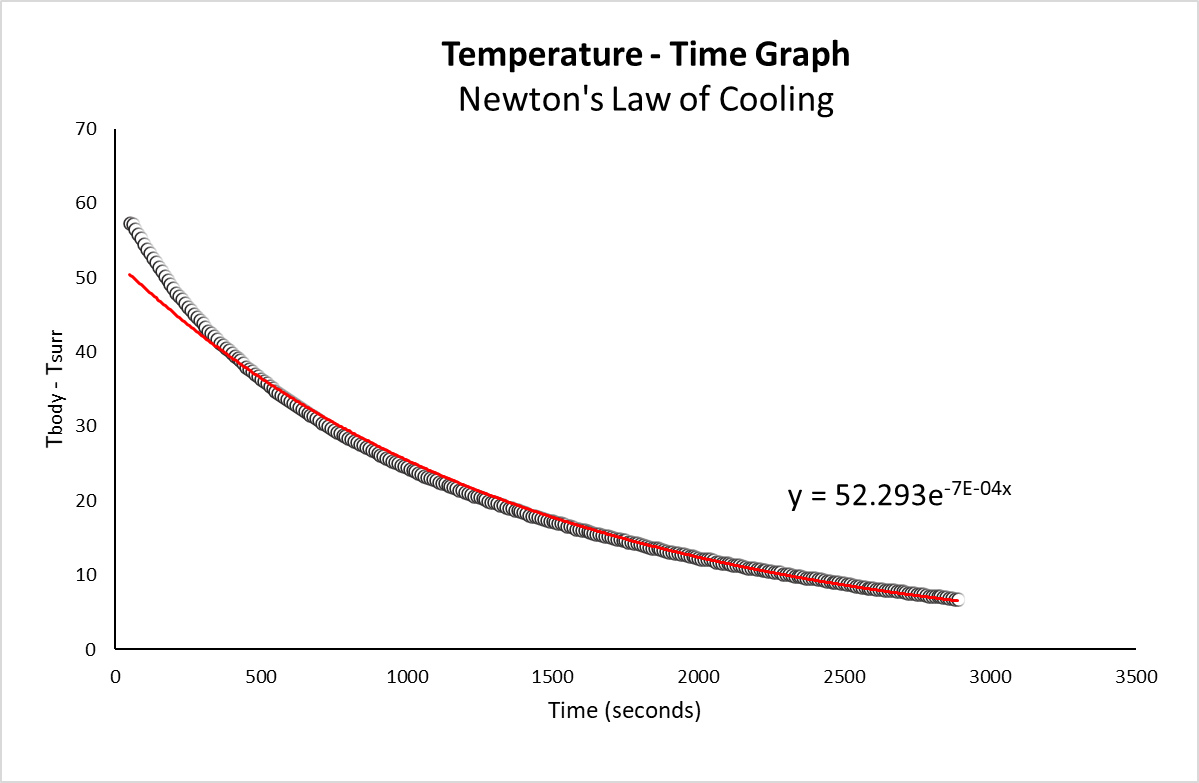
You can observe that the temperature drops rapidly at first, then slowly as the temperature difference (Tbody – Tsurr) decreases. Furthermore, the trendline equation is quite similar to equation (2). This is in agreement with Newton’s Law of Cooling. Similarly, according to Newton’s law of cooling, a graph between loge (Tbody – Tsurr) and time should be a straight line. In addition, it should have a negative slope. Let us check whether the plot is a straight line with negative slope or not.
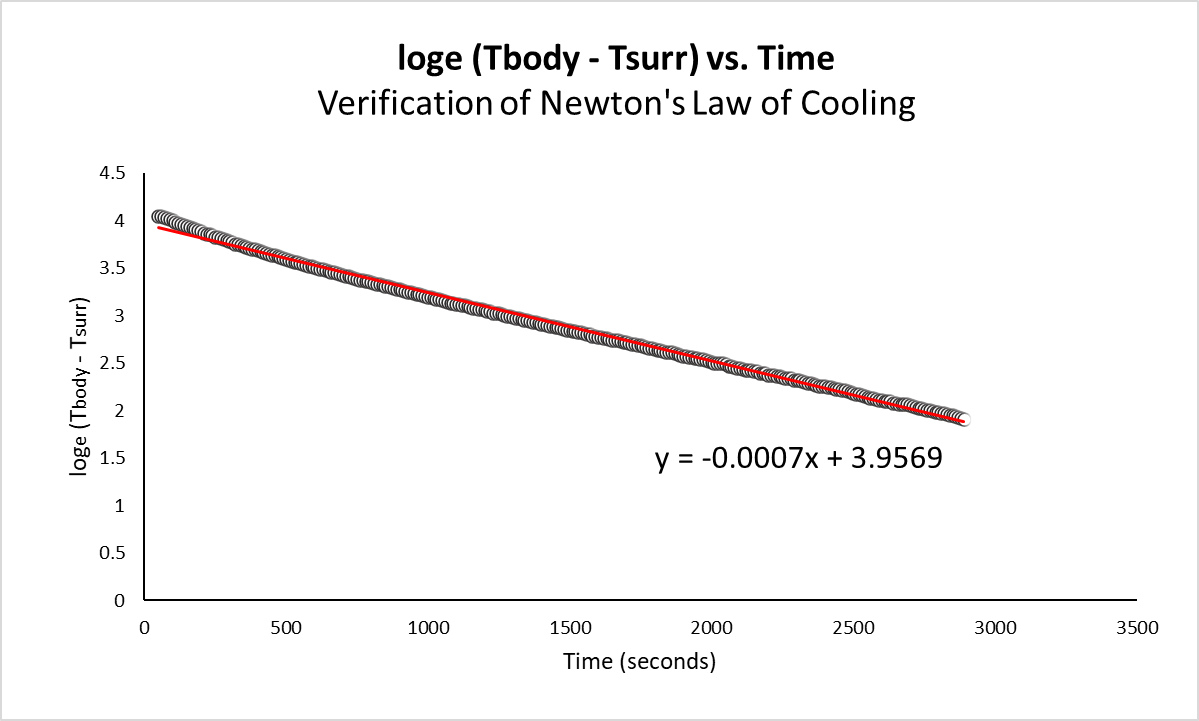
Thus we got the plot of loge (Tbody – Tsurr) against time as a straight line with -0.0007 slope. Thus, Newton’s law of cooling is verified.
Comparison of Data Obtained From Graphs
Let us compare equation (1) and the equation for Graph 2.
loge (Tbody – Tsurr) = -Kt + c …………………………………………………………………………….(1)
y = -0.0007x + 3.9569 ………………………………………………………………………………………..(3)
We can see that the two equations are similar. Hence, we ontain the K value as 0.0007 and the c value as 3.9569. Similarly, we can also compare equation(2) and the equation for Graph 1.
Tbody – Tsurr = C e-Kt ……………………………………………………………………………………………(2)
y = 52.293 e-7E-04x ……………………………………………………………………………………………..(4)
These are also similar equations. Furthermore, comparing these equation gives the K value as 0.0007 and the C value as 52.293. Hence, we can see that the K value for both graphs is 0.0007.
Conclusion
This is an excellent example of an Arduino-based project. The goal of this project was to use an Arduino to verify Newton’s law of cooling. This project makes use of the Arduino UNO board.. A waterproof temperature sensor, DS18B20, was also used. Its purpose was to measure the temperature of the water. Finally, Newton’s law of cooling was verified using the Temperature – Time graph and the loge (Tbody – Tsurr) vs. Time graph. Both of these graphs were found to be in agreement with Newton’s law of cooling. In addition, the K value in both graphs was 0.0007.
About the Author
Rosemary Salin is an Associate Chemist at Cademix Institute of Technology, Austria with a Master of Science in Chemistry. Her interests include studying scientific problems and finding different solutions to them through experiments.
Furthermore, she was a recipient of the INSPIRE (Innovation in Science Pursuit for Inspired Research) Scholarship from 2016 to 2021. It is a scholarship program implemented by the Department of Science and Technology (DST), Government of India. It is given to deserving students doing bachelor’s and master’s courses in Natural and Basic Sciences. Moreover, she is a member of the Cademix Career Autopilot Program. She is available for new opportunities. Please feel free to contact her.
E-mails:
rosemary.salin@cademix.org
rosemarysalin99@gmail.com
Linkedin:
https://www.linkedin.com/in/rosemary-salin/
Keywords Related to Verification Newton’s Law of Cooling Using Arduino
Arduino, Arduino UNO, Breadboard, Newton’s law of cooling, Cooling constant, DS18B20 temperature sensor, Resistors, Light emitting diode (LED), Exponential decay, Dallas Temperature library, One Wire library, Digital pin, Analog pin, Digital input, Analog input, Arduino ide, Arduino sketch, Arduino programming language, void setup, void loop, if function.
Power-supply, Programming, Arduino software, Usb-port, Male to Male jumper wires, Male to female jumper wires, Digital temperature sensor, sensors, Output pin, Input pin, Voltage common collector (VCC), Ground (GND), C programming, Serial port, Digital sensor, Analog sensor, Arduino compatible sensor.