016

Renovierung eines Bestandsgebäudes – Erfahrungsbericht aus Planung und Umsetzung in 2025

Estimated Reading Time: 10 minutes

Dieser Artikel dokumentiert die Renovierung eines älteren Bestandsgebäudes aus der Perspektive der Planung, Umsetzung und fachlichen Entscheidungsfindung. Im Mittelpunkt steht Renovierung nicht als isolierte Baumaßnahme, sondern als ganzheitlicher Prozess, der den respektvollen Umgang mit bestehender Bausubstanz, die Verbesserung von Sicherheit und Energieeffizienz sowie die Anpassung an zeitgemäße Nutzungsanforderungen miteinander verbindet. Anhand eines realisierten Projekts wird gezeigt, wie architektonische Identität bewahrt, technische Systeme erneuert und räumliche Qualitäten weiterentwickelt werden können, ohne den historischen Charakter des Gebäudes zu verlieren. Der Beitrag versteht sich als praxisnaher Erfahrungsbericht und verdeutlicht, dass qualitätsvolle Renovierung einen nachhaltigen Beitrag zur langfristigen Nutzung und zum Erhalt urbaner Strukturen leisten kann.
Nazanin Farkhondeh, Cademix Institute of Technology, Austria

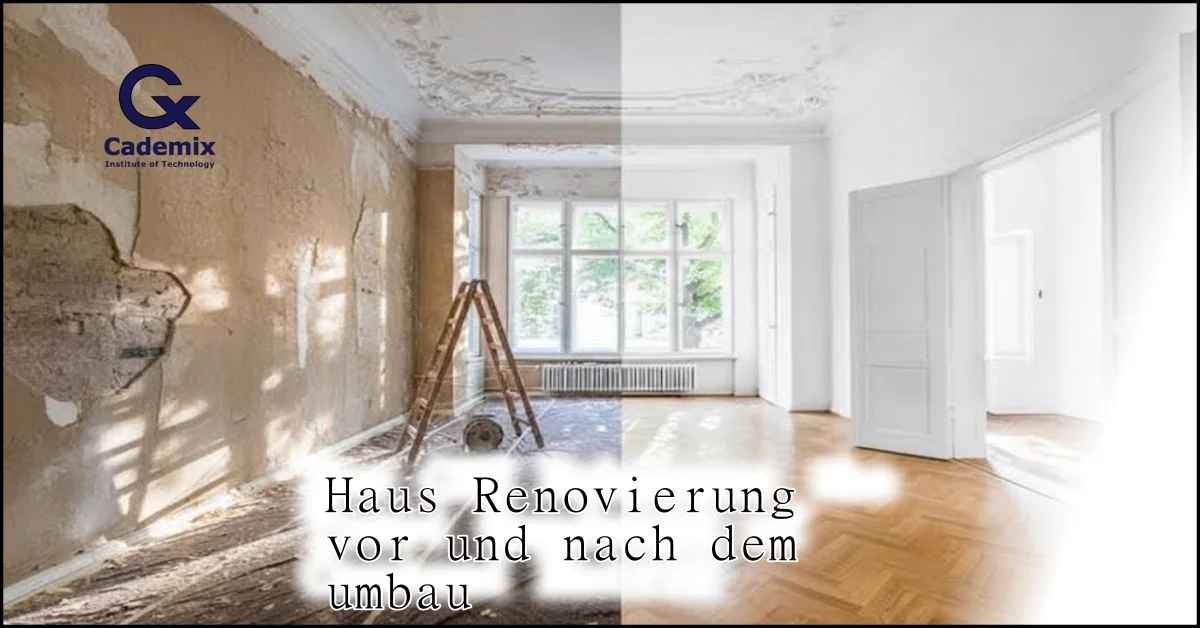
Renovierung als Haltung, nicht als Maßnahme

Renovierung ist kein rein technischer Vorgang. In meiner beruflichen Praxis habe ich Renovierung immer als eine Haltung verstanden – als bewusste Entscheidung, mit bestehender Bausubstanz verantwortungsvoll umzugehen, statt sie durch standardisierte Neubauprozesse zu ersetzen. Gerade bei älteren Gebäuden geht es nicht nur um Substanz, sondern um Erinnerung, Identität und städtebauliche Kontinuität.

Dieses Projekt steht exemplarisch für diese Haltung. Es handelt sich um die umfassende Renovierung eines älteren Gebäudes, das zwar funktional und technisch stark überholt war, dessen architektonischer Charakter jedoch nach wie vor eine klare Qualität besaß. Die Aufgabe bestand nicht darin, etwas völlig Neues zu schaffen, sondern das Vorhandene weiterzudenken.

Der folgende Artikel dokumentiert diesen Prozess aus der Perspektive der Planung, der technischen Umsetzung und der inhaltlichen Entscheidungen. Er versteht sich nicht als theoretische Abhandlung, sondern als praxisnaher Erfahrungsbericht aus einem realisierten Renovierungsprojekt.


Das Gebäude und sein Kontext

Das Gebäude befand sich in einem gewachsenen urbanen Umfeld und war Teil eines etablierten Stadtgefüges. Seine Entstehung liegt mehrere Jahrzehnte zurück, was sich sowohl in der Bauweise als auch in der Grundrissstruktur deutlich zeigte. Zum Zeitpunkt der Renovierung entsprach es weder aktuellen technischen Standards noch zeitgemäßen Nutzungsanforderungen.

Gleichzeitig verfügte das Gebäude über Eigenschaften, die im heutigen Bauen selten geworden sind. Die Proportionen waren ausgewogen, die Fassadengliederung ruhig und präzise, und die verwendeten Materialien vermittelten eine handwerkliche Qualität, die über reine Zweckmäßigkeit hinausging.

Gerade diese Merkmale führten früh zu der Entscheidung, auf einen Abriss zu verzichten. Eine Renovierung erschien nicht nur wirtschaftlich sinnvoll, sondern auch architektonisch und städtebaulich verantwortungsvoll. Das Gebäude hatte eine Geschichte – und diese sollte nicht ausgelöscht, sondern weitergeführt werden.


016 1

Zielsetzung der Renovierung

Die Definition klarer Ziele war ein entscheidender Schritt zu Beginn des Projekts. Ohne eine präzise Zielsetzung besteht bei Renovierungen die Gefahr, sich in Einzelmaßnahmen zu verlieren oder widersprüchliche Entscheidungen zu treffen.

Im Zentrum stand der Anspruch, die architektonische Identität des Gebäudes zu bewahren und gleichzeitig seine Nutzbarkeit grundlegend zu verbessern. Die Renovierung sollte nicht museal wirken, sondern ein Gebäude hervorbringen, das heutigen Anforderungen gerecht wird, ohne seine Herkunft zu verleugnen.

Ein weiterer Schwerpunkt lag auf der strukturellen Sicherheit und der technischen Erneuerung. Das Gebäude musste den aktuellen Normen entsprechen, ohne dass diese Anpassungen sichtbar dominierend werden. Renovierung bedeutete hier, technische Notwendigkeit und gestalterische Zurückhaltung in Einklang zu bringen.


Bestandsanalyse als Grundlage jeder Entscheidung

Eine sorgfältige Bestandsanalyse ist bei jeder Renovierung unverzichtbar. In diesem Projekt bildete sie die Grundlage aller weiteren Schritte. Es ging nicht nur darum, Schäden zu identifizieren, sondern das Gebäude als System zu verstehen.

Die Tragstruktur wurde detailliert untersucht, ebenso die vorhandenen Materialien und deren Zustand. Dabei zeigte sich, dass viele Bauteile trotz ihres Alters noch über eine solide Substanz verfügten, während andere Bereiche gezielte Eingriffe erforderten.

Parallel dazu wurden die bestehenden Installationen analysiert. Heizung, Elektrik und Leitungsführung entsprachen nicht mehr den heutigen Anforderungen und mussten vollständig neu gedacht werden. Diese Erkenntnisse flossen direkt in das Planungskonzept ein und verhinderten spätere improvisierte Lösungen.


Entwurf und konzeptioneller Ansatz der Renovierung

Der Entwurfsprozess war geprägt von der Frage, wie viel Veränderung notwendig und wie viel Zurückhaltung sinnvoll ist. Renovierung bedeutet immer auch, Entscheidungen über Eingriffe zu treffen – und bewusst auf andere zu verzichten.

Die äußere Erscheinung des Gebäudes blieb weitgehend erhalten. Veränderungen an der Fassade wurden auf ein Minimum reduziert und beschränkten sich auf technische Optimierungen und notwendige Instandsetzungen. Neue Elemente wurden so gestaltet, dass sie klar als zeitgenössische Ergänzungen erkennbar sind, ohne sich in den Vordergrund zu drängen.

Im Inneren hingegen war mehr Spielraum für Anpassungen vorhanden. Hier konnte die Renovierung genutzt werden, um räumliche Qualitäten neu zu definieren, ohne die Grundstruktur des Gebäudes zu zerstören. Dieser bewusste Unterschied zwischen äußerer Zurückhaltung und innerer Weiterentwicklung prägte den gesamten Entwurfsansatz.


Statische Ertüchtigung und Sicherheit

Ein zentraler Bestandteil der Renovierung war die statische Ertüchtigung des Gebäudes. Altersbedingte Schwächen, frühere Umbauten und veränderte Nutzungsanforderungen machten gezielte Maßnahmen erforderlich.

Diese Eingriffe wurden mit großer Sorgfalt geplant. Ziel war es, die Tragfähigkeit und Sicherheit deutlich zu erhöhen, ohne die architektonische Erscheinung zu verändern. Verstärkungen erfolgten dort, wo sie konstruktiv sinnvoll waren, und blieben nach Möglichkeit unsichtbar.

Die Renovierung zeigt hier exemplarisch, dass Sicherheit und Ästhetik keine Gegensätze sein müssen. Durch präzise Planung lassen sich selbst umfangreiche statische Maßnahmen so integrieren, dass sie das Gesamtbild nicht beeinträchtigen.


Technische Erneuerung als unsichtbare Qualität

Die vollständige Erneuerung der technischen Infrastruktur war einer der aufwendigsten Teile der Renovierung. Alte Systeme wurden entfernt und durch zeitgemäße Lösungen ersetzt, die sowohl effizient als auch langlebig sind.

Besonderes Augenmerk lag auf der Energieeffizienz. Durch verbesserte Dämmung, optimierte Heizsysteme und eine durchdachte Haustechnik konnte der Energieverbrauch deutlich reduziert werden. Diese Maßnahmen sind nach außen kaum sichtbar, tragen jedoch maßgeblich zur langfristigen Qualität des Gebäudes bei.

Gerade bei Renovierungen zeigt sich, dass technische Qualität oft im Verborgenen liegt. Ein gut renoviertes Gebäude erkennt man nicht an auffälligen Installationen, sondern an seiner ruhigen, selbstverständlichen Funktionalität.


Räumliche Neuorganisation und Wohnqualität

Ein weiterer Schwerpunkt der Renovierung lag auf der Verbesserung der inneren Raumstruktur. Die ursprünglichen Grundrisse waren stark fragmentiert und entsprachen nicht mehr den heutigen Anforderungen an Flexibilität und Offenheit.

Durch gezielte Eingriffe konnten Räume geöffnet, Sichtbeziehungen verbessert und natürliche Belichtung verstärkt werden. Gleichzeitig wurde darauf geachtet, die ursprüngliche Logik des Gebäudes nicht zu zerstören. Die Renovierung verstand sich hier als Weiterentwicklung, nicht als radikaler Umbau.

Besonders wertvoll war die Reaktivierung zuvor wenig genutzter Bereiche. Flächen, die früher kaum Aufenthaltsqualität boten, wurden in funktionale und gut belichtete Räume transformiert. Dadurch gewann das Gebäude nicht nur an Fläche, sondern vor allem an Nutzungsqualität.


Materialien und Detailentscheidungen

Die Auswahl der Materialien spielte eine entscheidende Rolle für den Charakter der Renovierung. Neue Materialien sollten den Bestand ergänzen, nicht imitieren. Gleichzeitig mussten sie langlebig und wartungsarm sein.

In vielen Bereichen wurde bewusst mit einfachen, robusten Materialien gearbeitet, deren Qualität sich erst im Gebrauch zeigt. Details wurden reduziert ausgeführt, um den Fokus auf Raumwirkung und Proportionen zu legen.

Diese Zurückhaltung ist typisch für hochwertige Renovierungsprojekte im mitteleuropäischen Raum, insbesondere in Österreich, wo Klarheit und Ehrlichkeit im Umgang mit Materialien als Qualitätsmerkmal gelten.

020

Herausforderungen im Renovierungsprozess

Kein Renovierungsprojekt verläuft ohne Herausforderungen. Auch hier traten im Laufe der Umsetzung unerwartete Situationen auf, die flexible Anpassungen erforderten.

Besonders anspruchsvoll war die Koordination zwischen bestehenden Bauteilen und neuen Eingriffen. Jede Entscheidung musste sorgfältig abgewogen werden, da Fehler im Bestand oft schwerer zu korrigieren sind als im Neubau.

Durch eine klare Projektstruktur, enge Abstimmung aller Beteiligten und realistische Zeitplanung konnten diese Herausforderungen jedoch bewältigt werden, ohne die Qualität des Ergebnisses zu gefährden.

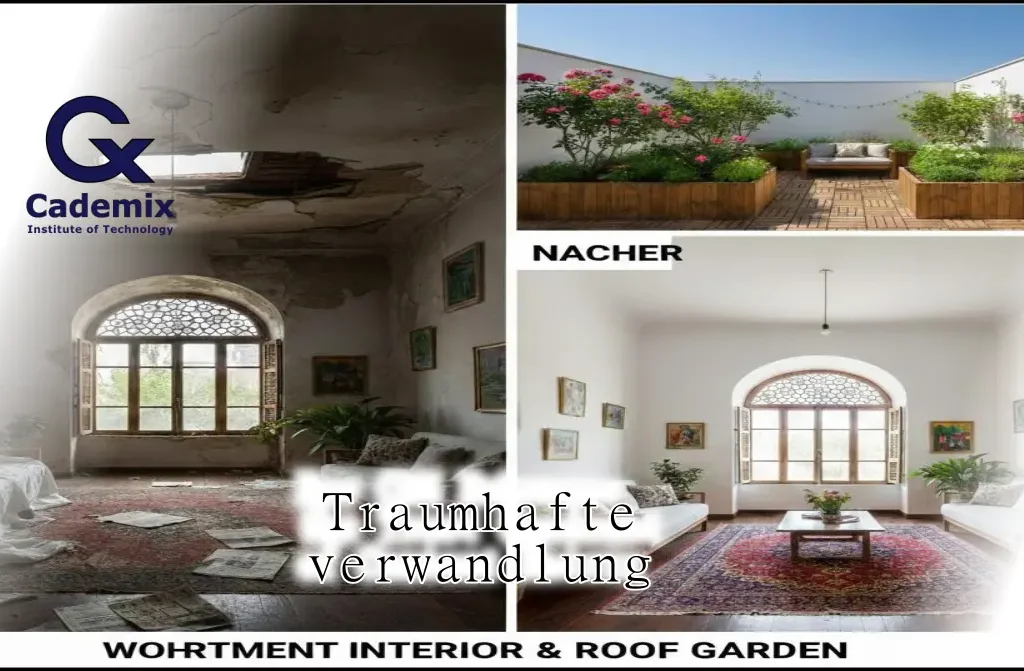
Projektbeispiel: Renovierung eines Bestandsgebäudes in Teheran (Iran)

Ein konkretes Beispiel für die im Artikel beschriebene Herangehensweise an Renovierung ist ein Projekt, das wir in Teheran realisiert haben. Das Gebäude befand sich in einem innerstädtischen Quartier mit überwiegend älterer Bausubstanz und wies deutliche Spuren jahrzehntelanger Nutzung auf. Ziel der Renovierung war es nicht, das Gebäude grundlegend zu verändern, sondern seinen baulichen Zustand präzise zu analysieren, Schwachstellen zu identifizieren und auf dieser Basis eine nachhaltige Erneuerung umzusetzen.

Ein wesentlicher Bestandteil dieses Projekts war die detaillierte Bestandsaufnahme vor Ort. Die vorhandene Bausubstanz wurde systematisch geprüft, unter anderem hinsichtlich Materialzustand, Oberflächen, Feuchtigkeitseintrag und thermischem Verhalten der Außenwände. Diese Untersuchungen bildeten die Grundlage für alle weiteren Entscheidungen und ermöglichten es, Eingriffe gezielt und verhältnismäßig zu planen, anstatt pauschale Maßnahmen anzuwenden.

Im Rahmen der Renovierung lag ein besonderer Fokus auf der Gebäudehülle. Die Außenflächen zeigten altersbedingte Abnutzungen, die sowohl ästhetische als auch funktionale Auswirkungen hatten. Durch eine Kombination aus Instandsetzung, materialgerechter Behandlung und gezielten Verbesserungen konnte die Substanz gesichert und gleichzeitig die Lebensdauer des Gebäudes deutlich verlängert werden. Dabei wurde bewusst darauf geachtet, den Charakter des Bestands zu erhalten und keine gestalterischen Brüche zu erzeugen.

Auch dieses Projekt verdeutlicht, dass Renovierung unabhängig vom geografischen Kontext nach denselben professionellen Prinzipien erfolgen sollte: sorgfältige Analyse, Respekt vor dem Bestand und klare Zieldefinition. Die Erfahrungen aus Teheran zeigen, dass eine strukturierte und verantwortungsvolle Renovierung nicht nur die technische Qualität eines Gebäudes verbessert, sondern auch einen langfristigen Beitrag zur Werterhaltung und Nutzbarkeit leistet.

Nachhaltigkeit und langfristige Perspektive der Renovierung

Ein zunehmend wichtiger Aspekt zeitgenössischer Architektur ist die Frage der Nachhaltigkeit. In diesem Zusammenhang gewinnt die Renovierung bestehender Gebäude eine strategische Bedeutung, die weit über rein wirtschaftliche Überlegungen hinausgeht. Jedes Bestandsgebäude repräsentiert bereits gebundene Energie, Ressourcen und kulturellen Wert. Eine sorgfältig geplante Renovierung ermöglicht es, diese vorhandenen Potenziale weiter zu nutzen, anstatt sie durch Abriss und Neubau zu vernichten.

Im vorliegenden Projekt wurde Nachhaltigkeit nicht als isoliertes technisches Ziel verstanden, sondern als integraler Bestandteil des gesamten Planungsprozesses. Bereits in der frühen Konzeptphase wurde geprüft, welche Bauteile erhalten, repariert oder angepasst werden können. Diese Herangehensweise führte nicht nur zu einer Reduktion von Bauabfällen, sondern auch zu einer bewussteren Auseinandersetzung mit dem Wert des Bestands.

Ein weiterer zentraler Aspekt der nachhaltigen Renovierung ist die Lebenszyklusperspektive. Entscheidungen über Materialien, Konstruktionen und technische Systeme wurden nicht allein auf Basis der Investitionskosten getroffen, sondern im Hinblick auf Wartungsaufwand, Langlebigkeit und Anpassungsfähigkeit. Gerade bei Renovierungen zeigt sich, dass kurzfristige Einsparungen häufig langfristig höhere Kosten verursachen können.

Darüber hinaus spielt die soziale Nachhaltigkeit eine wichtige Rolle. Eine Renovierung verändert nicht nur ein Gebäude, sondern beeinflusst auch seine Nutzer und sein Umfeld. Durch die Verbesserung von Raumqualität, Tageslichtführung und funktionaler Klarheit konnte das Gebäude wieder zu einem attraktiven und identitätsstiftenden Ort werden. Dies stärkt nicht nur die Nutzung, sondern auch die emotionale Bindung der Nutzer an den Ort.

Im internationalen Kontext wird Renovierung zunehmend als Schlüsselstrategie für eine verantwortungsvolle Stadtentwicklung verstanden. Während Neubau häufig mit hohem Ressourcenverbrauch verbunden ist, bietet die Arbeit im Bestand die Möglichkeit, bestehende Strukturen intelligent weiterzuentwickeln. Das hier beschriebene Projekt reiht sich in diese Haltung ein und zeigt exemplarisch, wie architektonische Qualität und ökologische Verantwortung miteinander verbunden werden können.

Nicht zuletzt hat dieses Projekt auch gezeigt, dass Renovierung ein Lernprozess ist – für Planer, Bauherren und alle Beteiligten. Der Umgang mit dem Bestand erfordert ein anderes Denken als der Neubau: weniger Kontrolle, mehr Dialog mit dem Vorgefundenen. Gerade in dieser Auseinandersetzung liegt jedoch ein großes kreatives Potenzial.

Zusammenfassend lässt sich sagen, dass Renovierung in diesem Projekt nicht als Einschränkung, sondern als Chance verstanden wurde. Als Chance, vorhandene Qualitäten sichtbar zu machen, neue Nutzungen zu ermöglichen und einen verantwortungsvollen Beitrag zur gebauten Umwelt zu leisten.

21 3

Fazit: Renovierung als nachhaltige Strategie

Die Renovierung dieses Gebäudes zeigt, dass Bestandserneuerung weit mehr sein kann als eine technische Notwendigkeit. Sie ist eine nachhaltige Strategie zur Stadtentwicklung, zur Ressourcenschonung und zum Erhalt kultureller Identität.

Dieses Projekt verdeutlicht, dass Renovierung dann besonders erfolgreich ist, wenn sie mit Respekt vor dem Bestehenden, klaren Zielen und einem langfristigen Qualitätsanspruch durchgeführt wird. Gerade im österreichischen Kontext, in dem historische Bausubstanz einen hohen Stellenwert besitzt, ist diese Herangehensweise von besonderer Bedeutung.

Renovierung ist in diesem Sinne kein Kompromiss, sondern eine bewusste Entscheidung für Qualität, Verantwortung und Kontinuität.

Ausblick

Die in diesem Artikel beschriebene Renovierung zeigt exemplarisch, welches Potenzial in der bewussten Arbeit mit dem Bestand liegt. In einer Zeit, in der Ressourcenknappheit, Klimaziele und städtebauliche Verdichtung zunehmend an Bedeutung gewinnen, wird Renovierung zu einer zentralen architektonischen Aufgabe. Zukünftige Projekte werden noch stärker darauf angewiesen sein, bestehende Strukturen intelligent weiterzuentwickeln, anstatt sie zu ersetzen. Die hier gewonnenen Erfahrungen bestätigen, dass eine präzise Analyse, eine klare konzeptionelle Haltung und interdisziplinäre Zusammenarbeit die entscheidenden Voraussetzungen für qualitätsvolle und nachhaltige Renovierung sind.

Referenz

1) EU-Gebäuderichtlinie – Energy Performance of Buildings Directive (EPBD)
Aktuelle EU-Richtlinie zur Gesamtenergieeffizienz von Gebäuden mit Renovierungszielen, Mindeststandards und nationalen Renovierungsplänen. Enthält Vorgaben zur Energieeffizienz bei Renovierungen.
https://en.wikipedia.org/wiki/Energy_Performance_of_Buildings_Directive_2024

2) National Building Renovation Plans – EU Kommission
Offizielle Seite der EU-Kommission zu nationalen Sanierungsplänen. Verpflichtet Mitgliedstaaten zur langfristi­gen Strategie für Renovierung und Dekarbonisierung des Gebäudebestands bis 2050.
https://energy.ec.europa.eu/topics/energy-efficiency/energy-performance-buildings/national-building-renovation-plans_en

3) Energieeinsparverordnung (EnEV) / Gebäudeenergiegesetz (GEG) – Germany
Regelwerk zu Mindestenergieanforderungen bei Neubau und Renovierung in Deutschland; EnEV durch GEG ersetzt, gilt für Energieeffizienz im Gebäudebereich.
https://en.wikipedia.org/wiki/Energieeinsparverordnung

4) OIB-Mindeststandards Energieeffizienz & Renovierungspässe – Österreich
Österreichische Informationsseite zu Mindeststandards der Gebäudeenergieeffizienz, Renovierungspässen und strategischen Renovierungsplänen gemäß EU-Gebäuderichtlinie.
https://www.oib.or.at/nicht-kategorisiert/mindeststandards-fuer-die-energieeffizienz-renovierungspaesse-und-nationaler-gebaeuderenovierungsplan-in-der-neuen-eu-gebaeuderichtlinie-folge-1-von-2

5) EU-Richtlinie zur Gesamtenergieeffizienz von Gebäuden – Energieverbraucher.de
Erklärung zur Energieeffizienzrichtlinie und zu Anforderungen bei größeren Renovierungen (Mindestenergieeffizienz bei Bestandserneuerung).
https://www.energieverbraucher.de/de/gebaeuderichtlinie__415/

6) Gebäuderichtlinie (EPBD) – Gebaeudeforum.de
Übersicht zu den zentralen Vorgaben der EU-Gebäuderichtlinie, darunter Renovierungspässe, Effizienzanforderungen sowie technische Normen (z. B. Energieausweis, Gebäudeautomation).
https://www.gebaeudeforum.de/ordnungsrecht/eu-vorgaben/epbd/

7) European Green Deal – EU-Klimaschutzprogramm
Überblick über die EU-Strategie zur Dekarbonisierung, inklusive ambitionierter Ziele für Renovierung und Energieeffizienz des Gebäudebestands.
https://en.wikipedia.org/wiki/European_Green_Deal

8) German National Action Plan on Energy Efficiency (NAPE)
Nationaler Aktionsplan Deutschlands zur Energieeffizienz, der auch energieeffiziente Renovierung im Gebäudesektor adressiert; Basis u. a. EU-Energy-Efficiency-Directive.
https://en.wikipedia.org/wiki/German_National_Action_Plan_on_Energy_Efficiency

9) Passive House / EnerPHit Standard (Weltweit anerkannt)
Standard für hohe Energieeffizienz im Neubau und bei Renovierungen (EnerPHit = Passivhaus-Konzept für Bestandsgebäude), relevant für energieeffiziente Renovierungspraxis.
https://en.wikipedia.org/wiki/Passive_house

10) Wikipedia – Energieeffizienzrichtlinie (EED)
EU-Richtlinie zur Energieeffizienz (EED), Teil des gesetzlichen Rahmens, der Renovierungsanstrengungen im Gebäudesektor unterstützt.
https://en.wikipedia.org/wiki/EU_Energy_Efficiency_Directive_2012


Cover graphic showing the Power BI dashboard and Streamlit companion app over a map of Europe.

Power BI: 2 Best Practical EU Inflation Dashboards (Dashboard + Python)

Estimated Reading Time: 12 minutes

I built this project with Power BI to make Eurostat’s Harmonised Index of Consumer Prices (HICP) easier to explore in a way that is both comparative (across countries/regions) and decomposable (down into category, year, quarter, and month). The core deliverable is a Power BI report backed by a semantic model. The model standardizes time handling, country labeling, and category ordering so the visuals behave predictably under slicing and drill-down.

On top of the report, I added a lightweight Streamlit application as a companion UI. It reuses the same conceptual structure date range, country/region filters, COICOP categories, and metric selection in a web-first layout.

The result is a workflow where the Power BI file is the analytical source of truth for modeling and curated visuals, while the Python app offers an alternate way to browse the same series with a narrower deployment surface. The emphasis is not on novelty, but on engineering discipline in data shaping, metric definitions, and interaction design across two runtimes.


Saber Sojudi Abdee Fard

Introduction

When inflation spikes or cools, the first question is usually not “what is the number,” but “where is it coming from, and how does it compare.” I built this dashboard around that workflow: start from an overview (index and inflation rate trends across selected countries/regions), then move into composition (category contributions and drill paths), and finally allow per-country “profile pages” that summarize the category landscape for a given period.

A second requirement was practical reproducibility. The Power BI report is the main artifact, but I also added a small Streamlit app so the same dataset can be explored outside the Power BI desktop environment. The intent is not to replace the report; it is to provide a simpler, web-native view that preserves the same filter semantics and metric definitions.

Design constraints and non-goals

I kept the scope deliberately tight so the visuals remain interpretable under interactive filtering. The report focuses on a curated set of countries/regions and a small COICOP subset that supports stable labeling and ordering, rather than attempting to be a full Eurostat browser. The time grain is monthly and the primary series is the HICP index (2015=100), with inflation rates treated as derived analytics over that index. I also treat “latest” values as a semantic concept (“latest month with data in the current slice”) instead of a naive maximum calendar date, because empty tail months are common in time-series exploration.

This project is not a forecasting system and it does not attempt causal attribution of inflation movements. It also does not try to reconcile HICP movements against external macro variables or explain policy drivers. The Streamlit app is not intended to reproduce every Power BI visual; it is a companion interface that preserves the same filter semantics and metric definitions in a web-first layout.

Methodology

Data contract and grain

The model is designed around a single canonical grain: monthly observations keyed by (Date, geo, coicop). In Power BI, DimDate represents the monthly calendar and facts relate to it via a month-start Date column; DimGeo uses the Eurostat geo code as the join key with a separate display label (Country); and DimCOICOP uses the Eurostat coicop code as the join key with a separate display label (Category) and an explicit ordering column. Facts are intentionally narrow and metric-specific (index levels, inflation rates, weights), but they share the same slicing keys so a single set of slicers can filter the entire model consistently.

The Streamlit app enforces an equivalent contract at ingestion. It expects a monthly index table that can be normalized into: year, month, geo, geo_name, coicop, coicop_name, and index, plus a derived date representing the month start. Inflation rates are computed from the index series within each (geo, coicop) group using lagged values (previous month for MoM, 12 months prior for YoY), which implies a natural warm-up period: YoY values are undefined for the first 12 months of any series.

Data sourcing and parameterization

On the Power BI side, I structured the model around an explicit start and end month (as text parameters) so the report can generate a consistent monthly date spine and align all series to the same window. This choice simplifies both the UX (one date range slider) and the model logic (all measures can assume a monthly grain without defensive checks for mixed frequencies).

The dataset is handled via Power Query (M) with a “flat table” approach for facts: each table carries the keys needed for slicing (time, geography, COICOP category) and a single numeric value column per metric family (index, rates, weights). At the report layer, measures are responsible for turning these fact values into user-facing metrics and “latest” summaries in a way that respects slicers.

Semantic model design

I modeled the dataset as a star schema to keep filtering deterministic and to avoid ambiguous many-to-many behavior. The design uses a small set of dimensions (Date, Geography, COICOP category) and multiple fact tables specialized by metric type (index levels, month-over-month rate, year-over-year rate, and weights). This separation lets each table stay narrow and avoids overloading a single wide fact table with columns that do not share identical semantics.

tar schema model linking DimDate, DimGeo, and DimCOICOP to HICP fact tables for index, rates (MoM/YoY), and weights.

Figure 1: The semantic model is organized as a star schema with Date/Geo/COICOP dimensions filtering dedicated fact tables for index, rates, and weights.

Metric definitions and “latest” semantics

To keep the report consistent across visuals, I centralized calculations into measures. At the base, index values are aggregated from the index fact. Inflation rates are computed as ratios (current index over lagged index) minus one, expressed as percentages. This makes the definition explicit, auditable, and consistent with the time grain enforced by the date dimension.

For “latest” cards/bars, I avoid assuming that the maximum date in the date table is valid for every slice. Instead, a dedicated “latest date with data” measure determines the most recent month where the base metric is non-blank under the current filter context, and the latest-rate measures are defined as the metric evaluated at that date. This prevents misleading “latest” values when a user filters to a subset where some months are missing.

To keep the date slicer from extending beyond the available series, I also apply a cutoff mechanism: a measure computes the maximum slicer date (end of month before the latest data), and a boolean/flag measure can be used to hide dates beyond that cutoff. This improves the interaction quality because users are not encouraged to select an “empty” tail of months.

Report UX and interaction design

The report is organized around a small set of high-signal experiences:

  1. An overview page combining (a) index trajectories by date and country, (b) an annual inflation rate time series view, and (c) a “latest annual inflation rate” comparison bar chart.
  2. A drillable decomposition view that starts from an annual inflation rate and walks through country, category, year, quarter, and month.
  3. Per-country overview pages that summarize category-level annual inflation, category index levels, and the distribution of annual rates over time (useful for “what was typical vs. exceptional”).
Overview page with COICOP and date filters, index-by-country line chart, annual inflation ribbon chart, and latest inflation bar chart.

Figure 2: Overview layout: date filtering and COICOP selection drive index and inflation charts, with a “latest annual inflation rate” bar for quick comparison.

Decomposition tree drilling annual inflation rate by country, category, year, quarter, and month.

Figure 3: Decomposition path: annual inflation rate is broken down stepwise by country, category, and calendar breakdowns to reach month-level context.

Germany overview page showing annual inflation by category, index by category, and annual inflation rate over time.

Figure 4: Country view: a dedicated overview page summarizes category inflation, category index levels, and the time distribution of annual inflation for one country.

Mobile layout with filters and a bar chart of latest annual inflation rate by country.

Figure 5: Mobile-focused view and Streamlit companion UI: a compact “latest annual inflation rate by country” experience paired with a simplified filter panel. a filter-first sidebar and tabbed exploration views for annual YoY series, index trajectories, and supporting tables.

Companion Streamlit app architecture

The Streamlit app mirrors the report’s mental model: choose a date range, countries/regions, COICOP categories, and then explore one of several views (annual rate, monthly rate, index trajectories, and supporting tabular outputs). I designed it as a small module set: a main entrypoint for page layout and routing, helper utilities for data prep, a filters module to standardize selection logic, and a tabs module to keep view-specific plotting code isolated.

For correctness, the app also includes a simple “guardrails” strategy: it flags implausible month-over-month values (for example, extreme outliers) rather than silently accepting them. This is not a substitute for upstream data quality work, but it is a practical way to prevent a single malformed row from dominating a chart in an exploratory UI.

Streamlit UI with sidebar filters and a multi-country annual inflation time series line chart.

Figure 6: Streamlit companion UI: a filter-first sidebar and tabbed exploration views for annual YoY series, index trajectories, and supporting tables.

Key implementation notes

Key implementation notes

The Power BI deliverables are hicp_eu27.pbip / hicp_eu27.pbix. The semantic model metadata is stored under hicp_eu27.SemanticModel/definition/, and the report metadata is stored under hicp_eu27.Report/.

Core analytics are centralized in measures. The model defines base measures such as Index, Monthly inflation rate, and Annual inflation rate, and it also implements “latest-with-data” semantics through Latest Date (with data) and Annual inflation rate (Latest).

Time filtering is kept honest through explicit cutoff logic. Measures such as Max Slicer Date and Keep Date (≤ cutoff) prevent visuals and slicers from drifting into months that exist in the date table but do not have observations in the selected slice.

Report visuals are defined explicitly in the report metadata. In practice, the report uses a line chart for index trends, a ribbon chart for annual inflation over time, a clustered bar chart for latest annual inflation comparisons, a decomposition tree for drill paths, and tabular visuals for series browsing.

The Streamlit companion app uses app/main.py as the entry point, with app/tabs.py, app/filters.py, and app/helpers.py separating view logic, filtering semantics, and shared UI utilities. Static flag assets are stored under app/flags/.

Interaction model

I designed the interaction model around how people typically reason about inflation: compare, drill, and then contextualize. The overview experience prioritizes side-by-side comparisons across countries/regions over a shared date range, with a small number of visuals that answer distinct questions: the index trajectory (level), the inflation rate trajectory (change), and a “latest” comparison (current snapshot). Slicers are treated as first-class controls date range, country/region, and COICOP category and the model is structured so those slicers propagate deterministically across all visuals.

For decomposition, I use an explicit drill path rather than forcing the reader to infer breakdowns across multiple charts. The decomposition view starts at an annual inflation rate and allows stepwise refinement through country, category, and calendar breakdowns (year → quarter → month), so the reader can move from headline behavior to a specific period and basket component without losing context. The per-country pages then act as “profiles”: once a country is selected, the visuals shift from comparison to composition, summarizing category differences and the distribution of annual rates over time.

In the Streamlit app, the same interaction principles are implemented as a filter-first sidebar plus tabbed views. Tabs separate the mental tasks (YoY trends, MoM trends, index levels, latest comparisons, and an exportable series table), while optional toggles control how series are separated (by country, by category, or both) to keep multi-series charts readable as the selection grows.

Results

The primary success criterion for this project is interaction correctness: slicers and filters must produce coherent results across different visual types without requiring users to understand measure-level details. In practice, the report behaves as intended in three “validation checkpoints.”

First, the overview page supports side-by-side country comparisons over a single monthly date range, while remaining stable under COICOP category selection. The index plot and inflation-rate visuals update together, and the “latest annual inflation rate” bar chart remains meaningful because “latest” is defined by data availability rather than by the maximum calendar month.

Second, the decomposition view provides an explicit reasoning path from a headline annual rate into a specific country/category and then into calendar breakdowns. This reduces the need to mentally join multiple charts: the drill path is encoded in the interaction itself.

Third, the per-country overview pages turn a filtered slice into a “profile” that is easy to read: which categories have higher annual inflation, how category indices compare, and how annual inflation distributes over time. This design is particularly useful when the user wants to compare the shape of inflation dynamics across countries rather than just comparing single-point estimates.

Discussion

A recurring design trade-off in this project is where to place logic: in Power Query, in the semantic model, or in the application layer. I chose to keep the facts relatively “raw but standardized” (keys + numeric values) and then express most analytic intent in measures. That makes the metric definitions inspectable and reduces the risk that a transformation silently diverges from what the visuals imply.

Another trade-off is scope control. The model is deliberately constrained to a set of countries/regions and COICOP categories that support clean ordering and readable comparisons. This improves the story and the UI, but it also means the model is not a general-purpose Eurostat browser. If I were productizing this, I would likely add a “wide mode” that dynamically imports more categories and geographies, alongside a curated “core mode” that preserves the current report design.

Finally, the Streamlit app demonstrates portability, but it also introduces the need to keep metric definitions aligned across two runtimes. I mitigated this by mirroring the report’s concepts (metrics, filters, and guardrails) rather than trying to recreate every Power BI visual. The app is most valuable when it stays narrow: fast slicing, clear trend lines, and a readable series table.

Ten essential lessons

  1. I treated the monthly grain as non-negotiable. Everything keys to (Date, geo, coicop).
  2. A star schema keeps cross-filtering stable when multiple fact tables share dimensions.
  3. “Latest” must be semantic, not MAX(Date). I used “latest-with-data” for KPIs.
  4. I applied an explicit slicer cutoff to avoid empty trailing months.
  5. Stable ordering improves readability. I used explicit order columns for geos and categories.
  6. Scope control is a UX feature. I constrained geos and COICOP groups for interpretability.
  7. Narrow facts preserve provenance. Index, rates, and weights remain distinct.
  8. In Streamlit, I centralized filtering so every tab uses the same selection semantics.
  9. Exploratory dashboards need guardrails. I null extreme MoM/YoY values.
  10. Responsiveness matters. I cache ingestion and use layout strategies for dense selections.

Conclusion

This project is a compact example of how I approach analytics engineering: define a stable monthly grain, build a star schema that filters cleanly, centralize metric semantics in measures, and design visuals around the user’s reasoning path rather than around chart variety. Power BI is the primary artifact, and the Streamlit app is a pragmatic companion that reuses the same filter-and-metric concepts in a web-first UI.

The next step is straightforward: document the model decisions (especially “latest” semantics and cutoff logic) directly inside the repo, and decide whether the Streamlit app should read from an exported model snapshot or from a shared data extraction step to reduce drift risk.

References

  1. S. Sojudi, “Eurostat-HICP: Power BI HICP dashboard and Streamlit companion app,” GitHub repository, 2025. https://github.com/sabers13/Eurostat-HICP.
  2. Microsoft, “Power BI documentation,” Microsoft Learn. https://learn.microsoft.com/power-bi/.
  3. Microsoft, “Data Analysis Expressions (DAX) reference,” Microsoft Learn. https://learn.microsoft.com/dax/.
  4. Microsoft, “Power Query M language reference,” Microsoft Learn. https://learn.microsoft.com/powerquery-m/.
  5. Streamlit, Inc., “Streamlit documentation,” 2025. https://docs.streamlit.io/.
  6. Plotly Technologies Inc., “Plotly Python documentation,” 2025. https://plotly.com/python/.
  7. Eurostat, “Harmonised Index of Consumer Prices (HICP) data and metadata,” 2025. https://ec.europa.eu/eurostat/web/main/data/database.
  8. Eurostat, “Eurostat data web services (API) documentation,” 2025. https://ec.europa.eu/eurostat/web/main/data/web-services.

Architecture banner showing admin and user panels connected to a SQL Server database

Building a Reliable Library Management System with 2 Roles: Python UI(Tkinter) and SQL Server

Estimated Reading Time: 16 minutes

I built a Python/Tkinter desktop application to demonstrate core library-management workflows. The application uses Microsoft SQL Server as its backend and connects via pyodbc through a 64-bit Windows System DSN configured for the SQL ODBC driver stack (ODBC Driver 17). The project is organized around typical CRUD operations for library entities and operational flows such as account management and book circulation. The intended end-to-end flows include database initialization, role-based login (admin and user), user registration, adding books, borrowing and returning books, suspending and releasing users, and renewing subscriptions; these flows are described as intended behavior rather than personally validated execution. During implementation, I addressed practical reliability issues commonly encountered in local SQL Server development, including driver encryption settings (e.g., TrustServerCertificate), safe handling of GO batch separators in SQL scripts, and rerunnable (idempotent) table creation. The design also reflects the realities of schema dependency management, such as foreign key ordering and constraint-driven creation/seeding. The project scope is intentionally limited to a single-machine desktop deployment; it is not a web application and does not include an automated test suite.
Saber Sojudi Abdee Fard

Introduction

I built this Library Management System as a desktop-first, database-backed application to exercise the full path from relational modeling to application integration. The core goal is not a “feature-rich library product,” but a clear demonstration of schema design, referential integrity, and CRUD-style workflows exposed through a Tkinter GUI while persisting state in Microsoft SQL Server.

A deliberate early design choice was to treat local developer setup as part of the system, not an afterthought. The project assumes a Windows 64-bit environment and a SQL Server instance (Express/Developer) reachable via a 64-bit System DSN named SQL ODBC using ODBC Driver 17. For local development, the documentation explicitly calls out the common encryption friction point with Driver 17 and suggests either disabling encryption or enabling encryption while trusting the server certificate, which aligns with the reliability lessons captured in the project snapshot.

At the data layer, the schema is centered around a small set of entities Publisher, Category, Book, Member, Transactions, and User_tbl that together model catalog metadata, membership identity, subscription validity, and circulation events. In the ERD, Book references both Publisher and Category (one-to-many in each direction), and Transactions acts as the operational log linking a Member to a Book with dates for borrowing/returning (including due/return dates). The design also separates member identity (Member) from subscription state (User_tbl) through a one-to-one relationship, which is a simple way to keep “who the user is” distinct from “membership validity.”

This project’s scope is intentionally bounded. It is not a web application, it assumes a single-machine DSN-based setup, and it does not include an automated test suite; the project documentation frames it as an educational implementation rather than a production-hardened system.

Library ERD showing entities and relationships

Figure 1 The schema backbone: books are categorized and published, transactions record borrow/return activity, and membership validity is separated into a dedicated subscription table.

Methodology

Database setup and shared utilities

I treated the database as a first-class subsystem rather than an opaque dependency, because most of the application’s correctness depends on consistent schema state and predictable connectivity. The project standardizes connectivity through a Windows 64-bit System DSN named SQL ODBC, and uses pyodbc to open a cursor against a fixed target database (LibraryDB). The connection string is explicit about the common ODBC Driver 17 development friction: encryption can be disabled (Encrypt=no) for local development, or enabled with TrustServerCertificate=yes depending on the developer’s environment and SQL Server configuration. This decision aligns with the project’s “single-machine DSN setup” scope and keeps runtime behavior deterministic across scripts.

To avoid duplicating boilerplate across many standalone Tkinter scripts, I centralized the lowest-level helpers in utils.py. In practice, that file functions as the project’s shared “platform layer”: it owns DB cursor creation, input validation helpers (email/phone), and the password hashing helper used in account creation and bootstrapping.

The schema can be created in two ways, which gives the project a pragmatic “belt and suspenders” setup story:

  1. Python-driven idempotent schema creation (table_creation.py) checks information_schema and sys.indexes before creating base tables and indexes. If any required table is missing, it creates the full set (publisher, book, category, member, subscription table, and transactions) and then builds secondary indexes to support common lookup paths such as book title, author, and member username. The same script separately applies named foreign key constraints (with cascade behavior) only if they do not already exist, and it bootstraps a default admin account if one does not exist. This “check-then-create” approach makes schema creation re-runnable without failing on already-created objects, which is the project’s main safeguard against re-run failures during iterative development.
  2. SQL file batch execution (run_sql_folder.py) executes the .sql files in numeric order (e.g., 1-...sql, 2-...sql) and explicitly supports GO batch separators by splitting scripts into batches using a regex. This matters because GO is not a T SQL statement; it is a client-side batch delimiter, and without pre-processing it will typically break naïve executors. The runner therefore converts a folder of SQL scripts into reliably executable batches and commits each batch.

A related helper exists in utils.py (insert_data_to_tables) that attempts to seed tables by scanning the current directory for .sql files, splitting on semicolons, and executing statements when the target table is empty (or near-empty). This provides a lightweight seeding mechanism, but it is intentionally less strict than the GO-aware runner; in the article, I will describe it as a convenience seeding helper rather than the primary “authoritative” database migration mechanism.

At the schema level, the database design enforces core invariants in the table definitions and constraints: book.status is constrained to a small enumerated set (“In Stock”, “Out of Stock”, “Borrowed”), member.role is constrained to (“Admin”, “User”), and subscription status is constrained to (“Valid”, “Suspend”). The explicit constraints simplify application logic because invalid states are rejected at the database boundary rather than being “soft rules” in UI code.

Authentication, account lifecycle, and role routing

The application’s entrypoint (login.py) is more than a UI screen it also acts as a bootstrapping coordinator that ensures the database is in a usable state before any authentication decision is made. At startup, initialize_database() calls the schema and index creation routines, provisions a default admin account, attempts to seed data, and then applies foreign key constraints. This sequencing is intentional: it makes first-run setup largely self-contained and reduces “works only after manual SQL setup” failure modes, while still keeping the overall system aligned with a local SQL Server development workflow.

Once initialized, the login flow uses a simple but explicit contract: the user submits a username and password, selects a role from a dropdown (“Admin” or “User”), and the application verifies both credentials and role alignment against the database record. The code fetches the member row by username, hashes the entered password, and compares it to the stored hash. It then enforces a role gate: an admin account cannot enter through the “User” route, and a user account cannot enter through the “Admin” route. This guards the navigation boundary between admin and user panels without relying on hidden UI conventions.

The account creation path is implemented as a separate Tkinter screen (create_account.py) that inserts a new member with role fixed to User. Before insertion, it validates required fields, checks that the password confirmation matches, and uses shared validators for email format and phone number format. It also checks username uniqueness with a query that counts existing rows grouped by username, and it refuses registration if the username is already taken. Successful registration writes the new member record and clears the form fields to avoid accidental duplicate submissions.

Password reset is implemented as a lightweight “forgot password” screen (forgetpassword.py). The flow is intentionally minimal: given a username and a new password (with confirmation), it verifies that the username exists in member, then updates the stored password hash. This keeps credential recovery self-contained inside the same data model as login and avoids separate recovery tables or email workflows, which fits the project’s desktop-scope constraints.

Login screen with role selection and password field

Figure 2 The login boundary: users authenticate with a username/password and explicitly choose Admin vs User, which is checked against the stored role before routing to the relevant panel.

Registration form for creating a new library account

Figure 3 User registration captures member identity fields and applies basic validation before inserting a member record with role set to User.

Role-specific panels and profile management

After authentication, the application routes the user into one of two role-specific control surfaces: an admin panel for operational control and a user panel for day-to-day library usage. I implemented these as distinct Tkinter windows, each acting as a small navigation hub that dispatches into focused, single-purpose screens. This “screen-per-script” structure keeps each workflow isolated and reduces the cognitive load of large, monolithic UI modules.

On the admin side, admin_panel.py provides entry points to the book catalog view, user list view, user suspension view, and the admin’s own profile page, plus a guarded logout action that requires confirmation before returning to the login window. The panel itself does not implement the workflows; it acts as a router that destroys the current window and transfers control to the relevant module. That pattern is consistent across the codebase and is the main way UI state is managed without a central controller.

On the user side, user_panel.py is intentionally narrower: it routes to subscription management, borrowing, returning, and the user profile. It passes a user_id (member_id) across windows as the primary identity token for user-scoped operations. This aligns with the schema design: member_id is the stable key for linking identity to circulation and subscription state, and the UI reuses that same key for most user flows.

Profile views for both roles follow the same implementation model: read from the member table using a parameterized query, then render the result in a ttk.Treeview. Admin profile lookup is username-based, while user profile lookup is member_id-based; both approaches are consistent with how the rest of the UI passes identity around (admins are handled by username at entry, users by id after login). The profile screens also provide an “Edit Profile” action that transitions into a dedicated edit form.

The edit forms (admin_edit_profile.py and user_edit_profile.py) are implemented as partial-update screens: they collect only the fields the user actually filled in and then execute one UPDATE statement per field. This is a pragmatic way to avoid overwriting existing values with empty strings and it makes the update logic easy to reason about. The user edit screen additionally routes email and phone through explicit validators before updating the database. Password changes are stored as a hash in the same field used by login, keeping credential semantics consistent across registration, editing, and recovery.

Admin panel with navigation to book list, profile, and user controls

Figure 4 The admin control surface routes into operational workflows (catalog management, user list, and suspension) without embedding the business logic in the panel itself.

Catalog management and circulation workflows

The core “library” behavior in this project is implemented as a set of focused screens that sit directly on top of a small number of database tables: book and publisher for the catalog, category for book categorization, and transactions for circulation history. Rather than hiding SQL behind a separate repository layer, these modules keep the database interaction close to the UI event handlers, with parameterized queries and explicit commits. That choice makes the data flow easy to trace in a learning-oriented codebase: button click → query/update → refreshed view.

On the admin side, booklist.py provides the catalog “truth view” using a join across book, publisher, and category. The query pulls the book’s identity, price, publisher, author, status, and category name(s), and then populates a ttk.Treeview. Because the category table can contain multiple rows per book_id, the code includes a post-processing step that merges categories for the same book into a single display value so the list behaves like a denormalized catalog view without losing the underlying row-level representation. Search is implemented as a set of narrow SQL variants (name, author, publisher, status, category) driven by a radio-button selector, and removal explicitly deletes dependent category rows before deleting the book row to avoid foreign key conflicts.

Adding a book (addbook.py) is implemented as a two-step write that mirrors the schema. The admin enters book metadata plus a publisher name and a category name. The screen first resolves publisher_id by publisher name, inserts a new row into book with an initial status of "In Stock" and a publish date, and then inserts a category row pointing back to the created book_id. In this design, “category” behaves like a book-to-category association table (even though it is named category), which is consistent with how the list view joins categories back onto books.

On the user side, circulation is tracked as an append-only event stream in transactions with a mirrored “current availability” indicator stored in book.status. Borrowing (borrowBook.py) checks the selected row’s inventory status and only proceeds when the book is "In Stock". A successful borrow inserts a "Borrow" transaction for the current member_id and updates the corresponding book.status to "Borrowed". Returning (bookReturn.py) reconstructs the user’s currently borrowed set by counting "Borrow" versus "Return" events per book_id; it displays only those books with exactly one more borrow than return, and a return action records a "Return" transaction and restores the book’s status to "In Stock". The return screen also computes a simple cost estimate as a function of days since the borrow transaction date, which demonstrates how transactional history can drive derived UI metrics.

A few small contracts hold this together cleanly:

  • Availability gating: the UI treats book.status as the immediate guard for whether a book can be borrowed, using "In Stock" as the only borrowable state.
  • Event log + snapshot state: transactions provides a history (“Borrow”/“Return”), while book.status provides the current snapshot for fast display and filtering.
  • User scoping: user-facing operations consistently act on member_id (passed into the screens as user_id) for all transaction writes and reads.
Book list view with search filters and inventory status table

Figure 5 The catalog view surfaces the join of book metadata, publisher, category, and availability status, and it is the main UI surface that reflects the current database state.

Subscription validity and administrative user controls

Beyond catalog and circulation, the project includes a small set of “operations” screens that make membership state explicit and controllable. I kept this logic close to the database tables that represent it: user_tbl stores subscription validity and an expiration date, while member stores identity and role. The UI surfaces these as two complementary control planes: users can extend their own validity period, and admins can inspect, remove, or suspend accounts.

The user-facing subscription screen (subscription.py) treats expire_date as the canonical definition of remaining time. It fetches the user’s current expiration date from user_tbl, computes remaining days relative to date.today(), and displays that countdown prominently. Renewal is implemented as an additive operation: pressing a 3-month, 6-month, or 1-year button adds a relativedelta(months=...) offset to the existing expiration date and writes it back with an UPDATE on the current member_id. This design is intentionally simple: it preserves history in the sense that renewals are always cumulative, and it avoids hard resets that could unintentionally shorten a membership.

On the admin side, userList.py provides an inspection and maintenance view over library accounts by joining member with user_tbl and listing both identity fields and the current status value. From there, the admin can (a) load the full list of valid/suspended users, (b) suspend a selected user by setting user_tbl.status to 'Suspend', and (c) remove a selected user entirely. Removal is implemented as an explicit dependency-ordered delete: the code deletes the user’s transactions first, then the associated user_tbl record, and finally the member record, and then refreshes the listing. Even in a small project, this ordering matters because it aligns with foreign-key dependencies and prevents the most common “cannot delete because it is referenced” failure mode.

Suspended-user management is separated into its own screen (suspendedUsers.py) rather than being an overloaded state inside the main user list. That module filters the join to only users with status 'Suspend', displays them in a table, and provides a “Release User” operation that restores user_tbl.status back to 'Valid'. This split keeps the administrative workflow clearer: “review all users” versus “review only suspended users,” each with its own narrow actions.

Key implementation notes

  • Documentation and system intent: README.md (environment assumptions, DSN requirements, intended workflows, and setup scripts).
  • Schema and relationships: erd/erd diagram.pdf and the Mermaid-based ERD definition embedded in erd/erd lib.html.
  • ERD tooling used in the repo: the single-file “ERD Maker” HTML described in erd/README.md.
  • DB connection and shared helpers: utils.py (ODBC Driver 17 connection string, cursor factory, MD5 hashing, input validation, lightweight seed helper).
  • Idempotent schema + indexes + constraints + admin bootstrap: table_creation.py (existence checks via information_schema and sys.indexes; named FK constraints; default admin provisioning).
  • Deterministic SQL script execution with GO support: run_sql_folder.py (numeric ordering, batch splitting, per-batch commits).
  • Bootstrapping + login routing: login.py (initialize_database(), login(), role dropdown gate, panel dispatch).
  • Registration workflow: create_account.py (submit(), uniqueness check, validators, role assignment to User).
  • Credential reset workflow: forgetpassword.py (submit(), username lookup, password update).
  • Admin navigation hub: admin_panel.py (dispatch to book list, profile, user list, suspension; confirm-before-logout).
  • User navigation hub: user_panel.py (dispatch to subscription, borrow, return, profile; identity passed as member_id).
  • Profile read paths: admin_profile.py (username → member), user_profile.py (member_id → member), both rendered in ttk.Treeview.
  • Profile partial updates: admin_edit_profile.py, user_edit_profile.py (update only non-empty fields; user flow validates email/phone).
  • Admin catalog view, search, and deletion semantics: booklist.py (join-based listing, category aggregation for display, search modes, dependent-delete ordering).
  • Admin book creation path: addbook.py (publisher lookup, insert into book, then associate category).
  • User borrow flow: borrowBook.py (status gate, insert "Borrow" transaction, update book.status).
  • User return flow + “currently borrowed” reconstruction: bookReturn.py (borrow/return counting, insert "Return" transaction, restore status).
  • User renewal flow: subscription.py (remaining-days computation from expire_date, additive renewal using relativedelta, update-by-member_id).
  • Admin user inventory + suspension + deletion ordering: userList.py (join-based listing, status updates, dependency-ordered deletes).
  • Suspended-only view + release operation: suspendedUsers.py (filtered listing by status, restore to 'Valid').
  • Bootstrapped, re-runnable initialization: login.py, table_creation.py, run_sql_folder.py, utils.py.
  • Catalog and joins + display shaping: booklist.py, addbook.py.
  • Circulation eventing and snapshot updates: borrowBook.py, bookReturn.py.
  • Subscription and admin governance controls: subscription.py, userList.py, suspendedUsers.py.

Results

Operational checkpoints derived from the implementation

Because I did not personally execute the full end-to-end flows, I treat “results” here as the observable outcomes the implementation is designed to produce, based on the documented intent and the concrete code paths.

On first run, the application’s entry flow is designed to converge the environment into a usable state by creating the schema, adding indexes and foreign keys, and provisioning a default admin user if one does not already exist. That work is intentionally re-runnable: table creation and constraint application are guarded by existence checks to avoid failing on subsequent runs.

From there, the UI is structured so each workflow has a clear “database side effect” that can be verified by inspecting either (a) the UI tables (Treeviews) or (b) the underlying SQL Server tables:

  • Registration inserts a new member row with role set to User, after username uniqueness and basic validation checks.
  • Login validates credentials and role alignment, then routes to the correct panel.
  • Adding a book inserts into book and associates at least one category entry, after resolving the publisher relationship.
  • Borrowing records a "Borrow" event in transactions and updates book.status to "Borrowed" (only when status is "In Stock").
  • Returning records a "Return" event and restores book.status to "In Stock", while deriving the “currently borrowed” set from borrow/return event counts.
  • Subscription renewal updates user_tbl.expire_date by adding a fixed offset (3/6/12 months) to the current value.
  • Suspension and release toggle user_tbl.status between 'Suspend' and 'Valid', and administrative deletion performs dependency-ordered deletes to avoid foreign-key conflicts.

Catalog and circulation state coherence

A key operational result of the design is that the system maintains two complementary views of circulation:

  1. a durable event log (transactions) that records borrow/return history per member and book, and
  2. a current snapshot (book.status) that makes availability immediately filterable and enforceable at the UI boundary.

The borrow and return screens treat this split consistently: borrowing is gated by the snapshot state, while returning reconstructs “still borrowed” books from the event stream and then writes both a new event and an updated snapshot.

In the UI, the book list view is the most direct “state surface” for these outcomes because it combines book metadata with availability status and category associations in one table.

Membership visibility and administrative control outcomes

Membership validity is designed to be both user-visible and admin-enforceable:

  • For users, remaining validity is computed from expire_date relative to the current date, and renewals are cumulative (additive) rather than resetting the expiry.
  • For admins, account operability is controlled by explicit status transitions (Valid ↔︎ Suspend) and is visible in list views scoped to all users or suspended users only.

What “success” means for this project

For this build, I consider the system successful when the following properties hold in a repeatable local setup:

  • The schema can be created (and re-created) without manual intervention and without failing on re-run.
  • Role routing is explicit and enforced at login, so admin and user control surfaces remain separated by design.
  • Circulation produces consistent outcomes across transactions and book.status, so history and current availability agree.
  • Admin actions (suspend/release/delete) perform predictable state transitions without violating referential integrity.

References

[1] S. Sojudi Abdee Fard, “Library Management System,” GitHub repository, n.d.(GitHub)

[2] Python Software Foundation, “tkinter – Python interface to Tcl/Tk,” Python 3 Documentation, n.d. (Python documentation)

[3] Python Software Foundation, “Graphical user interfaces with Tk,” Python 3 Documentation, n.d. (Python documentation)

[4] M. Kleehammer et al., “pyodbc: Python ODBC bridge,” GitHub repository, n.d. (GitHub)

[5] pyodbc contributors, “pyodbc documentation,” n.d. (mkleehammer.github.io)

[6] Microsoft, “Connection encryption troubleshooting in the ODBC driver,” Microsoft Learn, Sep. 18, 2024. (Microsoft Learn)

[7] Microsoft, “Special cases for encrypting connections to SQL Server,” Microsoft Learn, Aug. 27, 2025. (Microsoft Learn)

[8] Microsoft, “DSN and Connection String Keywords and Attributes,” Microsoft Learn, n.d. (Microsoft Learn)

[9] Microsoft, “Download ODBC Driver for SQL Server,” Microsoft Learn. (Microsoft Learn)

[10] Microsoft, “SQL Server Downloads,” Microsoft, n.d. [Online]. (Microsoft)

[11] Microsoft, “Microsoft SQL Server 2022 Express,” Microsoft Download Center, Jul. 15, 2024. (Microsoft)

[12] dateutil contributors, “relativedelta,” dateutil documentation, n.d. [Online]. (dateutil.readthedocs.io)

[13] python-dateutil contributors, “python-dateutil,” PyPI, n.d. [Online]. (PyPI)

[14] Mermaid contributors, “Entity Relationship Diagrams,” Mermaid Documentation, n.d. (mermaid.ai)

[15] GitHub, Inc., “Creating Mermaid diagrams,” GitHub Docs, n.d. [Online]. (docs.github.com)

Allplan Nemetschek BIM Software

Allplan Nemetschek BIM Software – Ultimativer Vergleich mit Vorteilen & Nachteilen

Estimated Reading Time: 6 minutes

Von Hamed Salimian

Warum Allplan Nemetschek BIM Software 2025 unverzichtbar ist

Allplan Nemetschek BIM Software ist eine der bekanntesten und leistungsstärksten digitalen Lösungen für die Bau- und Architekturbranche. Architekten, Ingenieure und Bauunternehmen nutzen die Software weltweit, um Projekte effizient, präzise und zukunftssicher umzusetzen. In einer Zeit, in der die Digitalisierung und Nachhaltigkeit zentrale Rollen spielen, hat sich Allplan als unverzichtbares Werkzeug etabliert.

Dieser Artikel beleuchtet ausführlich die Geschichte von Allplan Nemetschek, die wichtigsten Funktionen, Einsatzbereiche, Vorteile und Nachteile sowie den Vergleich mit anderen BIM-Softwares wie Revit und ArchiCAD. Zudem werfen wir einen Blick in die Zukunft der Bauindustrie und die Rolle, die Allplan Nemetschek BIM Software dabei spielen wird.


Die Nemetschek Group – Fundament und Erfolgsgeschichte hinter Allplan

Die Nemetschek Group wurde 1963 von Prof. Georg Nemetschek in München gegründet. Aus einem kleinen Ingenieurbüro entstand in mehreren Entwicklungsstufen ein weltweit agierender Softwareverbund für die AEC-Branche (Architecture, Engineering, Construction). Prägend war dabei stets der Fokus auf digitale Planungsprozesse: erst CAD am Bildschirm, dann 3D-Modellierung und schließlich Building Information Modeling (BIM) als durchgängiger Datenstandard über alle Projektphasen hinweg. Nemetschek positionierte sich früh als Befürworter offener Workflows und treibt bis heute Open-BIM und Interoperabilität gegenüber proprietären Ökosystemen voran.

Heute umfasst der Konzern über 30 Marken, die verschiedene Disziplinen abdecken und sich gezielt ergänzen: Allplan für Architektur und Ingenieurbau, Graphisoft (ArchiCAD) für designorientierte BIM-Planung, Vectorworks mit starker Verankerung in Architektur, Landschaft und Entertainment, Bluebeam für baustellennahes PDF-basieres Planen/Prüfen, Solibri für Modellprüfung und Regelwerke, dRofus für Datenmanagement in Großprojekten sowie weitere Lösungen für Rendering, XR/VR, AV/Media und Kostenmanagement. Diese Markenautonomie – kombiniert mit gruppenweiter Technologie-Koordination – ist ein Kern der Nemetschek-Strategie: Spezialisierte Produkte bleiben nahe am Nutzer, Schnittstellen und Datenmodelle sichern den gemeinsamen Mehrwert.

Strategisch setzt Nemetschek auf drei Stoßrichtungen: (1) Cloud- und Plattformdienste für Kollaboration in Echtzeit (z. B. Common Data Environments, Model-Coordination, Issue-Management), (2) Datenqualität und Governance mittels automatischer Prüfungen, Standardisierung und Rückverfolgbarkeit, (3) Nachhaltigkeit und Lebenszyklusdenken, also Nutzung von BIM-Daten von der frühen Entwurfsphase über Bauausführung bis Betrieb/Facility Management. Damit bedient der Konzern nicht nur klassische Planungsbüros, sondern zunehmend Bauunternehmen, Betreiber und öffentliche Auftraggeber.

Im Marktvergleich punktet Nemetschek mit Breite und Tiefe: Statt „One-Size-Fits-All“ bietet die Gruppe spezialisierte Werkzeuge, die über IFC/BCF und weitere Standards reibungslos zusammenarbeiten. Das reduziert Medienbrüche, erleichtert internationale Zusammenarbeit und erhöht die Planungssicherheit – ein wesentlicher Grund, warum Nemetschek heute als einer der prägenden Treiber der digitalen Bauindustrie gilt.

2 2

Von CAD zu BIM: Die spannende Entwicklung von Allplan Nemetschek BIM Software

Die Anfänge von Allplan liegen in den frühen 1980er Jahren, einer Zeit, in der die ersten CAD-Lösungen auf den Markt kamen und den traditionellen Zeichenprozess am Brett ablösten. Während viele Programme damals noch auf zweidimensionale Konstruktionen beschränkt waren, gelang es Allplan bereits früh, eine Brücke in die dritte Dimension zu schlagen. Die Möglichkeit, nicht nur 2D-Pläne, sondern auch 3D-Modelle zu erstellen, machte die Software schnell zu einem Vorreiter in der digitalen Bauplanung.

Mit den steigenden Anforderungen der Bauindustrie wuchs auch der Funktionsumfang von Allplan kontinuierlich. Schritt für Schritt wurde das System ausgebaut: automatisierte Mengenermittlung, präzisere Kostenberechnung, verbesserte Visualisierungen und schließlich die vollständige Integration von Building Information Modeling (BIM). Jede neue Version brachte praxisorientierte Innovationen, die Architekten, Ingenieuren und Bauunternehmen halfen, effizienter und vernetzter zu arbeiten.

Heute ist Allplan Nemetschek BIM Software weit mehr als ein klassisches CAD-Werkzeug. Die Plattform bildet den gesamten Lebenszyklus eines Bauwerks ab – von der ersten Entwurfsidee über die detaillierte Planung und Bauausführung bis hin zum Betrieb und sogar zum Rückbau. Damit hat sich Allplan als eine der führenden Lösungen etabliert, die sowohl technische Präzision als auch Zukunftssicherheit garantiert.


Wichtige Funktionen der Allplan Nemetschek BIM Software – mehr als nur CAD

  1. 2D- und 3D-Modellierung
    Architekten können klassische Grundrisse, Ansichten und Schnitte erstellen, während Ingenieure komplexe Tragwerksmodelle planen.
  2. BIM-Integration
    Im Zentrum steht das digitale Gebäudemodell, das alle relevanten Daten wie Materialien, Mengen, Kosten und Zeitpläne umfasst.
  3. Echtzeit-Kollaboration
    Mit der Cloud-Plattform Allplan Bimplus können Projektteams weltweit zusammenarbeiten. Änderungen sind sofort sichtbar und reduzieren Fehler.
  4. Kosten- und Mengenermittlung
    Die Software erstellt automatisch präzise Berechnungen, was eine zuverlässige Budgetplanung ermöglicht.
  5. Visualisierung und Präsentation
    Mit Renderings und Animationen können Entwürfe realitätsnah präsentiert werden – ein Pluspunkt in der Kommunikation mit Bauherren.
  6. Interoperabilität
    Durch Unterstützung von Standards wie IFC und BCF lässt sich Allplan Nemetschek BIM Software problemlos mit anderen Programmen wie Revit oder ArchiCAD verknüpfen.

Wo Allplan Nemetschek BIM Software Architekten & Ingenieure unterstütz

  • Architektur: Von der ersten Skizze bis zur Bauausführung.
  • Ingenieurbau: Besonders stark in der Bewehrungs- und Tragwerksplanung.
  • Bauunternehmen: Nutzung für Bauablaufplanung und Kostenkontrolle.
  • Infrastruktur: Anwendung im Brücken-, Tunnel- und Straßenbau.
  • Facility Management: Nutzung der BIM-Daten im Gebäudebetrieb.

Die Vielseitigkeit macht Allplan Nemetschek BIM Software zu einer Lösung, die den gesamten Lebenszyklus eines Bauwerks begleitet.


Die größten Vorteile der Allplan Nemetschek BIM Software für Bauprojekte

  • Hohe Präzision: Besonders geschätzt in der Ingenieurplanung.
  • Flexibilität: Nutzbar für Architektur, Ingenieurbau und Bauausführung.
  • Visualisierung: Überzeugende Darstellungen für Bauherren und Investoren.
  • BIM-Integration: Durchgängige Datenkonsistenz ohne Informationsverluste.
  • Zukunftssicherheit: Regelmäßige Updates und Integration neuer Technologien.

Herausforderungen und Nachteile von Allplan – was du wissen solltest

  • Komplexität: Neue Nutzer benötigen Zeit für Schulungen.
  • Lizenzkosten: Teurer als einfache CAD-Programme.
  • Regionale Verbreitung: In Europa stark, international weniger präsent als Autodesk Revit.

Vergleich: Allplan Nemetschek BIM Software, Revit und ArchiCAD

  • Allplan Nemetschek BIM Software: Führend in Europa, besonders stark in der Ingenieur- und Bewehrungsplanung.
  • Revit (Autodesk): Weltweit am weitesten verbreitet, bevorzugt in Großprojekten.
  • ArchiCAD (Graphisoft): Sehr benutzerfreundlich, beliebt bei designorientierten Architekten.

Allplan überzeugt vor allem durch Detailtiefe und Präzision, während Revit von seiner globalen Reichweite profitiert.


Zukunftsperspektiven von Allplan Nemetschek BIM Software

Die Bauindustrie befindet sich in einem fundamentalen Wandel. Treiber dieses Prozesses sind die Digitalisierung, die Forderung nach mehr Nachhaltigkeit und der zunehmende Einsatz von Automatisierung. In diesem Kontext nimmt die Allplan Nemetschek BIM Software eine Schlüsselrolle ein, da sie technologische Entwicklungen aktiv integriert und ihren Anwendern praxisnah zur Verfügung stellt.Eine detaillierte Übersicht über die aktuellen Funktionen bietet die Allplan Produktseite.

Ein zentrales Thema ist der Ausbau von Cloud-Lösungen. Mit Allplan Bimplus hat Nemetschek eine Plattform geschaffen, die die Zusammenarbeit in Echtzeit ermöglicht. Architekten, Ingenieure und Bauunternehmen können unabhängig von Ort und Gerät auf dieselben Daten zugreifen, Modelle prüfen und Änderungen sofort synchronisieren. Dies steigert nicht nur die Effizienz, sondern reduziert auch Fehler und Nacharbeit erheblich.Die Nemetschek Group ist ein weltweit führender Anbieter von Software für die AEC-Branche. Mehr Informationen findest du direkt auf der offiziellen Website von Nemetschek.

Ebenso wichtig ist das Building Lifecycle Management (BLM). Hierbei werden die BIM-Daten nicht nur für Planung und Bau genutzt, sondern auch für den Betrieb und die Wartung von Gebäuden. Allplan entwickelt Funktionen, die es Betreibern erleichtern, Wartungszyklen zu steuern, Energieverbräuche zu optimieren und den gesamten Lebenszyklus eines Bauwerks digital abzubilden.

Die Künstliche Intelligenz (KI) eröffnet neue Möglichkeiten. Sie kann Routineaufgaben automatisieren, zum Beispiel das Erkennen von Konflikten in Modellen, die Generierung von Bauabläufen oder die Optimierung von Materialeinsätzen. Dadurch bleibt mehr Zeit für kreative und strategische Aufgaben im Planungsprozess.

Schließlich spielt die Nachhaltigkeit eine immer größere Rolle. Allplan unterstützt Planer dabei, ressourcenschonende Konzepte umzusetzen, CO₂-Emissionen zu reduzieren und alternative Materialien zu bewerten. In Kombination mit präzisen Simulationen entstehen so nachhaltigere Gebäude und Infrastrukturen.

Insgesamt zeigt sich, dass die Zukunft von Allplan Nemetschek BIM Software weit über klassische CAD- oder BIM-Funktionen hinausgeht. Die Plattform wird zunehmend zum integralen Werkzeug für eine digitalisierte, automatisierte und nachhaltige Bauindustrie.


Praxisbeispiele und Erfolgsgeschichten

  • Brückenbau in Deutschland: Präzise Bewehrungsplanung mit Allplan.
  • Wohnungsbau in Europa: Effiziente Zusammenarbeit zwischen Architekten und Ingenieuren.
  • Großprojekte im Nahen Osten: Nutzung der Cloud-Funktionen zur Koordination internationaler Teams.

Schulungen und Community

Ein wesentlicher Bestandteil für den Erfolg mit Allplan Nemetschek BIM Software ist die Ausbildung. Nemetschek bietet Online-Kurse, Tutorials und Zertifizierungen an. Zudem existiert eine aktive Community, in der Anwender Erfahrungen austauschen.


FAQ zu Allplan Nemetschek BIM Software

Ist Allplan Nemetschek BIM Software besser als Revit?
In Europa und im Ingenieurbau ja, international ist Revit verbreiteter.

Für wen eignet sich Allplan Nemetschek BIM Software?
Für Architekten, Ingenieure, Bauunternehmen und Facility Manager.

Welche Alternativen gibt es?
Revit, ArchiCAD, Vectorworks, Tekla Structures.


Fazit

Die Allplan Nemetschek BIM Software ist weit mehr als ein CAD-Programm. Sie ist eine umfassende Plattform für digitale Bauplanung, die Präzision, Flexibilität und Zukunftssicherheit vereint.

Trotz höherer Komplexität und Kosten überwiegen die Vorteile deutlich. Besonders für Architekten und Ingenieure, die auf Detailtreue und Effizienz setzen, ist Allplan die richtige Wahl.

In einer Branche, die sich durch Digitalisierung, Nachhaltigkeit und globale Vernetzung neu erfindet, wird Allplan Nemetschek BIM Software auch in Zukunft eine Schlüsselrolle spielen – sowohl in kleinen Büros als auch in internationalen Großprojekten.


Chat GPT, OpenAI, conversational AI, Generative Pre-trained Transformer, GPT-3, GPT-4, natural language processing, AI applications, AI advancements, human-like text generation. Discreet Censorship Approach to Maintaining a Healthy Social Media Community

Von Java EE zu Spring Boot

Estimated Reading Time: 5 minutes

Spring Boot entstand als Weiterentwicklung des Spring Frameworks, um die Grenzen von Java EE zu überwinden. Es vereinfacht Konfiguration, integriert moderne Tools, unterstützt Microservices und Cloud-Umgebungen und ermöglicht so eine schnellere und effizientere Softwareentwicklung.
Mobin Toufankhah, Cademix Institute of Technology


Zusammenfassung

Zu Beginn der 2010er Jahre standen Java-Entwickler vor zahlreichen Herausforderungen bei der Erstellung und Bereitstellung von Unternehmenssoftware. Die Konfigurationen waren oft aufwendig, die Einrichtung der Ausführungsumgebungen erforderte viel Zeit, und die Integration moderner Technologien wie Microservice-Architekturen oder Cloud-Infrastrukturen war nur mit großem Aufwand möglich. Zwar bot das Spring Framework im Vergleich zu Java EE bereits eine höhere Flexibilität, doch gerade in großen Projekten blieb der Bedarf an manueller Konfiguration und komplexer Abhängigkeitsverwaltung bestehen.

Spring Boot wurde entwickelt, um genau diese Schwächen zu überwinden. Es bietet automatisierte Konfiguration, eigenständig lauffähige Anwendungen und eine enge Verzahnung mit modernen Entwicklungswerkzeugen. Damit wird nicht nur der Entwicklungsprozess beschleunigt, sondern auch die Bereitstellung in produktiven Umgebungen erleichtert. Dieser Artikel untersucht den historischen Hintergrund, die früheren Einschränkungen und die Lösungen, die Spring Boot bietet, um die Anforderungen moderner Softwareentwicklung zu erfüllen.

Einleitung

Das Aufkommen von Spring Boot ist eng mit den Entwicklungen der Softwareindustrie in den letzten zehn bis fünfzehn Jahren verbunden. Unternehmen standen unter wachsendem Druck, immer schneller neue Funktionen bereitzustellen, ohne dabei auf Stabilität und Sicherheit zu verzichten. Die zunehmende Verbreitung verteilter Architekturen, die Verlagerung vieler Anwendungen in die Cloud und die steigende Komplexität der IT-Landschaften machten es notwendig, Software schneller und einfacher entwickeln zu können.

Spring Boot wurde nicht als vollständig neues Framework konzipiert, sondern als Weiterentwicklung des bestehenden Spring Frameworks. Die Idee war, die Flexibilität und Mächtigkeit des Spring-Ökosystems zu bewahren, aber gleichzeitig die Hürden zu senken, die mit der komplexen Konfiguration und dem hohen manuellen Aufwand verbunden waren. Mit seiner Einführung erhielten Entwickler ein Werkzeug, das den gesamten Lebenszyklus einer Anwendung – von der Entwicklung über das Testen bis zur Bereitstellung – deutlich vereinfachte.

Historischer Hintergrund

Das klassische Spring Framework entstand Anfang der 2000er Jahre als Antwort auf die Grenzen von Java EE, das damals der Industriestandard für Unternehmensanwendungen war. Java EE bot zwar eine große Funktionsvielfalt, war aber in der Praxis oft schwerfällig. Neue Projekte erforderten das Anlegen und Pflegen zahlreicher XML-Dateien. Jede kleine Änderung bedeutete oft Anpassungen an mehreren Stellen, was fehleranfällig war und viel Zeit in Anspruch nahm.

Darüber hinaus war der Entwicklungs- und Bereitstellungsprozess langsam. Entwickler mussten zunächst den Code kompilieren, anschließend ein Archivpaket (z. B. ein WAR-File) erstellen und dieses auf einem separaten Anwendungsserver deployen. Erst danach konnte eine Anwendung getestet werden. Das machte schnelle Iterationen schwierig und führte dazu, dass Projekte länger dauerten und häufiger unterbrochen wurden.

Die Integration neuer Technologien war ebenfalls problematisch. Wollte ein Unternehmen moderne Komponenten wie Messaging-Dienste, Monitoring-Werkzeuge oder Cloud-Dienste einführen, waren oft tiefgreifende Änderungen an der Architektur notwendig. Dies verlangsamte die Innovationsfähigkeit erheblich. Besonders hinderlich war zudem die Abhängigkeit von externen Servern wie GlassFish oder WildFly. Ohne diese konnten Anwendungen nicht ausgeführt werden. In einer Welt, die zunehmend auf DevOps-Ansätze und Cloud-Infrastrukturen setzte, war das ein klarer Nachteil.

Spring Boot brachte eine radikale Vereinfachung. Es bot automatische Konfiguration, die auf intelligenten Voreinstellungen basiert, Starter-Module, die gängige Abhängigkeiten gebündelt zur Verfügung stellen, und eingebettete Server, die externe Applikationsserver überflüssig machen. Damit wurden die Einstiegshürden für neue Projekte drastisch gesenkt und die Entwicklung beschleunigt.

Unterschiede zu anderen Frameworks

Auch außerhalb der Java-Welt existierten vergleichbare Probleme. Frameworks in .NET oder Python erforderten häufig ebenfalls umfangreiche Konfigurationsarbeit und waren auf externe Server oder Middleware angewiesen. Zudem war die Tool-Landschaft häufig fragmentiert: Entwickler mussten Sicherheitsfunktionen, Datenmanagement oder Caching separat einrichten und konfigurieren.

Spring Boot nahm sich dieser Schwächen gezielt an. Ein zentrales Merkmal ist die automatische Konfiguration, die es erlaubt, viele Einstellungen gar nicht mehr manuell vornehmen zu müssen. Stattdessen erkennt das Framework die eingesetzten Abhängigkeiten und konfiguriert sie intelligent voraus. Ebenso bedeutend ist die Möglichkeit, Anwendungen direkt mit eingebetteten Servern wie Tomcat, Jetty oder Undertow zu starten. Damit entfällt der klassische Deploy-Prozess auf einem externen Server – Entwickler können den Code direkt ausführen.

Darüber hinaus hat Spring Boot das gesamte Spring-Ökosystem besser integriert. Funktionen für Sicherheit, Datenbanken, Messaging oder Monitoring lassen sich ohne große Zusatzarbeit nutzen. Ein anschauliches Beispiel für die Vereinfachung ist das Tool Spring Initializr. Es ermöglicht Entwicklern, in wenigen Minuten ein vollständig lauffähiges Projekt zu generieren, das sofort gestartet und weiterentwickelt werden kann.

Vorteile und Nachteile

Die Vorteile von Spring Boot liegen auf der Hand. Neue Projekte können in kürzester Zeit aufgesetzt werden, was die Entwicklungszyklen erheblich beschleunigt. Durch die enge Unterstützung für Microservice-Architekturen eignet sich Spring Boot besonders für moderne Unternehmensanwendungen, die aus vielen kleinen, unabhängigen Diensten bestehen. Auch die Kompatibilität mit DevOps-Umgebungen ist ein entscheidender Pluspunkt: Anwendungen lassen sich problemlos in Container wie Docker packen und in Orchestrierungsplattformen wie Kubernetes integrieren. Mit Modulen wie Spring Boot Actuator wird zudem ein leistungsfähiges Monitoring ermöglicht, das für den Betrieb produktiver Systeme unverzichtbar ist.

Allerdings gibt es auch Nachteile. Spring Boot benötigt im Vergleich zu sehr leichten Frameworks mehr Speicher und Rechenleistung. Anwendungen, die mit Spring Boot erstellt werden, sind oft größere sogenannte „Fat JARs“, die mehr Platz beanspruchen als vergleichbare Artefakte in Frameworks wie Quarkus oder Micronaut. Außerdem entsteht durch die starke Bindung an das Spring-Ökosystem eine Abhängigkeit, die die Migration zu anderen Frameworks erschwert. Für komplexere Anpassungen bleibt zudem ein tiefes Verständnis der Spring-Architektur erforderlich, sodass die Lernkurve für fortgeschrittene Szenarien weiterhin steil sein kann.

Trotz dieser Nachteile gilt Spring Boot als besonders robust und produktionsreif. Zwar haben sich mit Jakarta EE, Quarkus, Micronaut oder Helidon Alternativen entwickelt, die zum Teil schnellere Startzeiten oder geringere Ressourcenanforderungen bieten. Dennoch dominiert Spring Boot den Markt, weil es einen ausgewogenen Mix aus Stabilität, Flexibilität und Funktionsvielfalt bietet.

Einsatzgebiete und typische Probleme, die Spring Boot löst

Spring Boot zeigt seine Stärken insbesondere dort, wo verschiedene Technologien parallel integriert werden müssen. Unternehmen, die mehrere Datenbanken, Messaging-Systeme oder Sicherheitslösungen kombinieren, profitieren von der hohen Modularität und den vorgefertigten Integrationen. Auch im Management größerer Entwicklerteams erweist sich das Framework als vorteilhaft, da es klare Standards setzt und wiederverwendbare Strukturen bietet.

Ein weiteres Einsatzfeld ist die schnelle Bereitstellung in hybriden oder Multi-Cloud-Umgebungen. Durch die Unabhängigkeit von externen Anwendungsservern können Anwendungen flexibel und ohne große Architekturänderungen deployt werden. Mit Funktionen wie Actuator, Health Checks und integrierten Metriken ist Spring Boot zudem bestens für den Betrieb in produktiven Systemen geeignet.

Schlusswort

Spring Boot kann als ingenieurtechnische Antwort auf die Einschränkungen von Java EE verstanden werden. Es ist nicht lediglich ein Ersatz, sondern eine logische Weiterentwicklung, die auf die realen Bedürfnisse von Entwicklern reagiert: weniger Komplexität, kürzere Lieferzeiten und eine hohe Anpassungsfähigkeit an sich wandelnde Infrastrukturen.

Die Bedeutung von Spring Boot wird auch in Zukunft groß bleiben. Mit der Unterstützung für Cloud-Native-Entwicklung, der Integration in Serverless-Umgebungen und der Möglichkeit, Anwendungen mit GraalVM als Native Images zu betreiben, passt sich das Framework an neue technologische Trends an. Dennoch sollte die Wahl von Spring Boot stets wohlüberlegt sein. Entscheidend sind die Anforderungen des jeweiligen Projekts, die Kapazitäten des Teams und die langfristige technische Strategie einer Organisation.

References

Spring Boot Overview (Wikipedia)
https://en.wikipedia.org/wiki/Spring_Boot

Jakarta EE Explained (Wikipedia)
https://en.wikipedia.org/wiki/Jakarta_EE

Payara Blog — Jakarta EE vs. Spring Boot: Choosing the Right Framework
https://blog.payara.fish/jakarta-ee-vs.-spring-boot-choosing-the-right-framework-for-your-project

Java Code Geeks — Spring Boot vs. Jakarta EE
https://www.javacodegeeks.com/2024/12/spring-boot-vs-jakarta-ee-choosing-the-right-framework-for-your-java-application.html

Nintriva — All-in-One Comparison Guide for Java EE vs. Spring Boot
https://nintriva.com/blog/java-ee-spring-boot-comparison/

Medium (Geek Culture) — Spring Boot 101: Introduction
https://medium.com/geekculture/spring-boot-101-introduction-6caef8b5a10

Blueprint-style overview of the 7-bit processor co-design workflow linking VHDL hardware, ASM/Python software, and the CPU datapath

A Practical 7-Bit Processor with a Python Assembler

Estimated Reading Time: 16 minutes

I built a compact 7-bit processor to explore hardware–software co-design end-to-end: defining a minimal instruction set, implementing the datapath and control in VHDL, and closing the loop with a small assembler that produces ROM-ready binaries. The design focuses on a small core of operations LOAD, ADD, SUB, and JNZ with an extended MULTIPLY instruction implemented using a shift-and-add approach to keep the hardware simple. Internally, the processor is decomposed into familiar blocks (ALU, register file, program counter, instruction register, ROM, and multiplexers), with a control unit described as an ASM-style state machine that sequences fetch, decode, and execute. A four-register file (R0R3) and a zero flag provide the minimum state and condition mechanism needed for basic control flow. To integrate software with the hardware model, I use a Python-based assembler that converts assembly-like inputs into the binary encodings expected by ROM initialization. The project is intended to be validated in simulation by observing program counter progression, register updates, and ALU outputs under representative instruction sequences.
Saber Sojudi Abdee Fard

Introduction

I designed this project to practice hardware–software co-design in a setting small enough to reason about completely. The core idea is straightforward: define a minimal instruction set, implement a complete processor around that ISA in VHDL, and connect it to a simple software tool a Python assembler that produces the exact 7-bit encodings the hardware expects. The result is an offline simulation workflow where I can iterate on both sides of the boundary: instruction semantics in hardware and program encoding in software.

The processor is intentionally constrained. Both data and instruction representations are 7 bits wide, and the ISA is limited to a small set of operations: LOAD, ADD, SUB, JNZ, and an extended MULTIPLY. Memory is ROM-based, and the goal is correctness and clarity in simulation rather than breadth of CPU features or performance. Within that scope, the design targets a complete “compile -> encode -> load -> simulate -> inspect” loop: compiling and simulating the VHDL modules, translating an assembly-like program through Conversion.py, loading the produced binary into Memory.vhd, and then validating behavior by inspecting the program counter, register updates, and ALU outputs in the simulator.

This article explains the system the way I worked with it: as a set of contracts between modules and between software and hardware. I focus on the architectural decomposition (datapath and control), the encoding boundary enforced by the assembler, and what constitutes a successful run in simulation. I also call out the explicit non-goals such as advanced control-flow features, richer memory models, or microarchitectural optimizations because the constraints are part of what makes the design teachable.

Methodology

Architecture overview

I implemented the processor as a small set of composable VHDL building blocks connected around a single 7-bit internal bus. The top-level entity (Processor) exposes CLK and RESET inputs and exports the four general-purpose register values (R0outR3out) specifically to make simulation inspection straightforward.

Inside Processor.vhd, the datapath is wired as follows:

  • A ROM (Memory) outputs a 7-bit word (MData) addressed by the program counter output (PC_OUT).
  • Two 4-to-1 multiplexers (MUX4x1) select ALU operands from the four register outputs (ROUT0ROUT3). Each mux is driven by a 2-bit selector (S0 for operand A, S1 for operand B).
  • The ALU computes a 7-bit result (ALURes) based on a 2-bit command (CMD).
  • A 2-to-1 “bus mux” (MUX2x1) selects what drives the shared internal bus (BUSout): either ROM data (MData) or the ALU result (ALURes), controlled by BUS_Sel.
  • The shared bus is then assigned to a single internal input (RIN <= BUSout) that feeds every state-holding element: the four registers, the instruction register (IR), and the program counter (PC) load their next value from RIN when their respective load control is asserted.

This wiring creates a clean contract boundary: computation happens in the ALU, storage happens in registers/IR/PC, and the only way values move is by selecting a source onto the bus and latching it into a destination on the next clock edge.

A control unit (control_unit) sits beside the datapath. It consumes the current instruction (ROUTIR, the instruction register output) and per-register zero indicators (ZR0ZR3), and it drives all load/select signals: LD0LD3, LDIR, LDPC, INC, BUS_Sel, plus the ALU command (CMD) and the two operand selectors (Sel0, Sel1).

Block diagram of the 7-bit CPU showing ROM, PC, shared RIN/BUS, register file, operand muxes, ALU, and control-unit signals

Figure 1 — The ROM, register file, and ALU are connected through a single bus-source mux that drives a shared internal bus (RIN), while the control unit sequences selects and load-enables for fetch and execute.

Control unit and instruction sequencing

I implemented the controller as an explicit enumerated-state machine in control_unit.vhd. The control unit decodes two fields from the 7-bit instruction:

  • y <= ROUTIR(6 downto 4) as a 3-bit opcode.
  • x <= ROUTIR(3 downto 2) as a 2-bit register selector (converted to an integer Reg_num for indexing the zero-flag vector).

The control flow uses these states (as defined in the state type): S0, S1, D, S2, S3, S4, S5, S6, S7, and S8. Operationally, they map to a compact fetch–decode–execute loop:

  • Fetch (S0): the controller asserts LDIR <= 1 while selecting ROM data onto the bus (BUS_Sel <= 0). In the same state it asserts INC <= 1 to advance the PC. Conceptually, this state is responsible for “IR <- M[PC]” and “PC <- PC + 1”.
  • Stabilize (S1): the controller deasserts INC and LDIR and transitions to decode.
  • Decode (D): the controller either halts, dispatches to an execute state based on y, or evaluates a conditional branch using the selected register’s zero flag.
    • A literal all-ones instruction (ROUTIR = "1111111") is treated as halt and transitions into S2, which self-loops.
    • If y = "000", it dispatches to Load (S3).
    • If y = "001", it dispatches to Add (S4).
    • If y = "010", it dispatches to Sub (S5).
    • If y = "100", it dispatches to Multiply (S8).
    • Otherwise, it treats the instruction as a conditional PC control operation that consults ZR(Reg_num) and chooses between S6 (load the PC) and S7 (skip).

The execute states drive the datapath in a very direct way:

  • Load (S3) asserts exactly one of LD0LD3 based on x, keeps the bus sourcing from ROM (BUS_Sel <= 0), and asserts INC <= 1 before returning to fetch. This matches a “load immediate/data word from ROM and step past it” pattern.
  • Add/Sub/Multiply (S4, S5, S8) select registers into the two ALU operand muxes (Sel0, Sel1), set CMD to the operation code ("00" for add, "01" for sub, "10" for multiply), switch the bus to the ALU result (BUS_Sel <= 1), and assert one of LD0LD3 to latch the result back into a register. In the current implementation, both operand selectors are derived from the same instruction field (x and ROUTIR(3 downto 2)), so both Sel0 and Sel1 are driven from the same two-bit slice.
  • PC load (S6) asserts LDPC <= 1 while selecting ROM data onto the bus (BUS_Sel <= 0) and returns to fetch. In combination with the top-level wiring (ROM addressed by PC_OUT, bus sourcing from MData), this implements an indirect jump target read: the PC loads the 7-bit word currently stored at the ROM address.
  • PC skip (S7) asserts INC <= 1 and returns to fetch. This acts as the complementary behavior to S6: when the condition is not met, the controller advances past the jump operand word.

That last pair (S6/S7) is a key contract in the design: conditional control flow is implemented by placing a jump target word in ROM immediately after the branch instruction, then either loading the PC from that word (taken) or incrementing past it (not taken). This keeps the instruction format small while still enabling label-based control flow at the assembly level.

Datapath components and local contracts

I structured the datapath around a small number of synchronous state-holding elements (registers, program counter, instruction register) and purely combinational plumbing (multiplexers and the ALU). The shared internal bus (RIN) is the only write-back path: every storage element loads from the same 7-bit value when its load-enable is asserted. That design choice keeps the movement of data explicit each cycle is “pick a source onto the bus, then latch it into one destination” which makes it straightforward to debug in simulation.

Register file and zero flags (Reg.vhd)

Each general-purpose register is implemented as a simple rising-edge latch with a load enable. The register stores a 7-bit vector (res) and continuously computes a per-register zero flag ZR. In this implementation, ZR is asserted high when the register content is exactly 0000000, and deasserted otherwise. Because the zero flag is derived from the stored register value (not the ALU result), conditional control flow is defined in terms of “what is currently in the selected register,” which is a clean contract for a small ISA.

A practical implication of this choice is that the condition mechanism is transparent to inspection: in simulation, I can interpret the branch condition by looking at the register value and its corresponding ZR* signal without needing an additional flag register.

Program counter semantics (PC.vhd)

The program counter is another 7-bit state element with three control inputs: CLR (asynchronous clear), LD (load from the bus), and INC (increment). The implementation uses a single internal accumulator (“inBUS” inside the clocked process) that can be loaded and incremented in the same cycle. If both LD and INC are asserted on a rising clock edge, the update order is “load, then increment,” which gives a well-defined behavior for any state machine that wants “PC <- operand + 1” rather than forcing two cycles.

In the top-level wiring, CLR is driven from the processor’s reset line (mapped through the RST signal), and the fetch phase relies on INC to advance sequentially through ROM addresses.

Instruction register (IR.vhd)

The instruction register is a minimal latch: on a rising clock edge, if LD is high, it captures the current bus value into an internal signal and exposes it as ROUT. There is no decode logic here by design; the controller consumes the raw 7-bit instruction word. This separation keeps “instruction storage” distinct from “instruction interpretation,” which is useful when iterating on encodings during co-design.

Combinational multiplexers (MUX2x1.vhd, MUX4x1.vhd)

I used two mux types:

  • A 2-to-1 mux selects the shared-bus source. In the current design, S=0 selects ROM data and S=1 selects the ALU result. This switch is effectively the “read vs compute” gate for the entire machine.
  • A 4-to-1 mux selects ALU operands from the four register outputs. The selector is two bits wide, built by concatenating the select lines inside the mux and mapping "00", "01", "10", "11" to R0, R1, R2, R3.

Both muxes are purely combinational. That means the timing contract is simple: control signals must be stable in time for the selected value to propagate to the bus (or ALU inputs) before the next rising edge, where it can be latched by the destination element.

ALU behavior and truncation (ALU.vhd)

The ALU accepts two 7-bit operands and a 2-bit CMD:

  • "00" performs unsigned addition.
  • "01" performs unsigned subtraction.
  • "10" performs multiplication via a shift-and-add loop.

Internally, both inputs are resized to 14 bits to allow intermediate growth during addition/subtraction/multiplication, and the multiplication iterates over the bits of IN1: for each set bit IN1(i), the ALU adds IN2 shifted left by i into an accumulator. This is a direct, minimal-hardware way to express multiplication in behavioral VHDL.

The key architectural contract is at the output: the ALU always returns only the lower 7 bits of the 14-bit intermediate result. In other words, arithmetic is effectively performed modulo (2^7) at the architectural boundary. That choice is consistent with the project’s 7-bit scope, but it also means overflow is handled by truncation rather than saturation or flagging.

shift add multiply

Figure 2 — Conceptual shift-and-add multiplication accumulates (IN2 << i) for each set bit IN1[i] into a 14-bit sum, then returns only the lower 7 bits as ALURes[6:0].

ROM and “program as VHDL” workflow (Memory.vhd)

The memory is implemented as a 128-entry ROM (instruction(127 downto 0)), addressed by the 7-bit program counter. The output is a direct combinational lookup: Data <= instruction(to_integer(unsigned(address))). The ROM contents are currently defined by assigning specific indices inside the VHDL architecture. This matches your intended workflow: use the Python assembler to generate 7-bit binary instruction words and then paste those encodings into Memory.vhd to run them in simulation.

The file also includes multiple annotated program variants. One example sequence is commented as an “add 7 with 4” demonstration, and another is structured as a small loop intended to exercise conditional branching and repeated arithmetic. A third variant (commented out) is positioned as a “hardware focus” multiplication path, contrasting with the loop-based approach. From an engineering perspective, keeping these snippets inline makes the simulation loop fast, but it also means “program loading” is manual and tightly coupled to the ROM source code rather than being a separate artifact (e.g., a memory initialization file).

Figure placement: A code figure that shows a short ROM snippet (a few consecutive instruction(i) <= "......."; lines) is useful here to make the “assembler output -> ROM initialization” boundary concrete.

Assembler and the hardware–software boundary

To make the processor usable as a co-design exercise rather than a pure hardware artifact, I included a small Python assembler (Assembler/Conversion.py) that translates assembly-like lines into binary strings that can be loaded into the ROM. The intent, as documented in the repository, is to run the conversion step first, then paste the produced encodings into Memory.vhd, and finally validate behavior in simulation by inspecting the program counter, register values, and ALU outputs.

The current assembler implementation is deliberately minimal: it tokenizes each line by removing commas and splitting on whitespace, looks up an opcode mnemonic in a small table, and then encodes operands by type. Register operands (R0R3) are encoded as 2-bit binary values, while any non-register operand is encoded as a 4-bit binary value. Each instruction line is therefore built by concatenating a fixed-width opcode field with one or more fixed-width operand fields, producing a binary string per line.

This assembler is also where the most important integration contract lives: the binary it emits must match the instruction word format the VHDL control unit expects. The README states the processor operates on 7-bit-wide instructions and provides an example encoding (ADD R1, R2 -> 0100010). In the current Conversion.py, however, the opcode table is 2 bits wide and only covers Load, ADD, SUB, and JNZ, with no explicit MULTIPLY support. In practice, that means the assembler represents the intended direction (software producing ROM-ready bits), but the exact bit-level encoding contract is something the project has to pin down consistently between README, assembler, and the VHDL decode logic. That “tight loop” of adjusting encodings until the fetch/decode/execute behavior matches expectations is part of the educational value of the co-design workflow.

Two targeted questions so I can describe the integration contract precisely in Section 6 (Results) and avoid guessing:

Key implementation notes

  • Source grounding: the narrative is based on README.md and the project snapshot you provided.
  • Entry points: hardware at src/Processor.vhd (top-level integration); software at Assembler/Conversion.py (assembly-to-binary conversion).
  • Core modules: src/ALU.vhd, src/control_unit.vhd, src/Memory.vhd, src/PC.vhd, src/IR.vhd, src/Reg.vhd, src/MUX2x1.vhd, src/MUX4x1.vhd.
  • Top-level integration: src/Processor.vhd instantiates and wires Reg, PC, IR, ALU, MUX4x1 (twice), MUX2x1, Memory, and control_unit, with a single internal bus (RIN <= BUSout) feeding all loadable elements.
  • Control surface: src/control_unit.vhd outputs LD0..LD3, LDIR, LDPC, INC, BUS_Sel, plus CMD, Sel0, and Sel1, and consumes ROUTIR and the per-register zero signals ZR0..ZR3.
  • Halt sentinel: the controller treats 1111111 as a dedicated halt instruction and transitions into a terminal self-loop state.
  • Reg.vhd: rising-edge storage with LD; ZR=1 iff the stored 7-bit value is 0000000.
  • PC.vhd: 7-bit counter with CLR (async clear), LD (load from bus), and INC (increment); supports “load then increment” if both asserted.
  • IR.vhd: rising-edge instruction latch controlled by LD.
  • MUX2x1.vhd: bus-source selector between ROM (I0) and ALU (I1) with a single select bit.
  • MUX4x1.vhd: operand selector over R0R3 driven by two select bits.
  • ALU.vhd: unsigned add/sub; multiply implemented via shift-and-add; output is truncated to the low 7 bits.
  • Memory.vhd: 128×7 ROM as an internal array with explicit per-address assignments; output is a combinational lookup addressed by PC.
  • Assembler entry point: assemble(assembly_code) consumes a multi-line string and returns a list of binary strings, one per parsed instruction line.
  • Assembler tokenization: commas are stripped (line.replace(",", "")), then tokens are split on whitespace; empty lines are ignored.
  • Assembler encoding: registers (R*) become 2-bit fields; non-register operands become 4-bit fields; the opcode is taken from opcode_table.
  • Assembler opcode coverage: Load, ADD, SUB, JNZ are defined; other instructions (including MULTIPLY) are not represented in the table.
  • Hardware inspection points: Processor exports R0outR3out explicitly, which makes it practical to validate instruction effects without adding extra debug modules.
  • Software-to-hardware boundary: assemble(...) emits binary strings from assembly-like lines; in the validated workflow these are used to populate the ROM in Memory.vhd.
  • Intended ISA surface: the README presents LOAD/ADD/SUB/JNZ plus an extended MULTIPLY, and frames validation as monitoring ALU output, register values, and program counter progression during simulation.
  • Documentation positioning: the README positions the project explicitly as a simulation-driven, educational processor build with a minimal ISA and a Python conversion step.
  • Encoding contract hotspot: the assembler’s opcode table and assemble(...) are the natural enforcement point for a single instruction-format contract once the bit layout is finalized.

Results

Because I did not build a dedicated VHDL testbench, validation for this project is based on interactive simulation: compiling the full design, loading a short program into the ROM, and then stepping the clock while inspecting the program counter, instruction register, control signals, ALU result, and the four register outputs. This approach matches the project’s educational scope: the primary outcome is a working hardware–software loop where I can translate assembly into binary, paste those encodings into the ROM, and observe the machine executing fetch–decode–execute in a waveform viewer.

Validation checkpoints

In practice, “success” in simulation is visible as a small set of repeatable checkpoints:

  • Fetch discipline: on each instruction boundary, the instruction register captures the ROM output while the program counter advances, yielding a stable next instruction word and a monotonic PC sequence.
  • Load path correctness: a LOAD sequence routes ROM data onto the internal bus and latches it into the selected register, so the register output changes exactly on the intended clock edge.
  • ALU path correctness: ADD and SUB route the ALU result onto the bus and latch it back into a register; the ALU output changes combinationally with operand selection, while architectural state changes only on clock edges.
  • Multiply behavior: the MULTIPLY operation produces a deterministic product consistent with a shift-and-add implementation, with the architectural output constrained to 7 bits (i.e., truncation on overflow) as part of the 7-bit design scope.
  • Conditional control flow observability: conditional branching is validated by correlating (a) the selected register value, (b) its zero flag, and (c) whether the PC is loaded from ROM or advanced past the next word. This makes the branch mechanism debuggable even without a testbench, because the condition and the control effect are both visible.

Artifacts produced

The durable artifacts from a run are simple but useful: (1) binary instruction words produced by the Python assembler and (2) waveform traces in the simulator that show the PC/IR/control/ALU/register timeline for a program. The repository also contains simulator-side artifacts (e.g., waveform databases) under src/, which is consistent with an interactive debug workflow rather than a scripted regression setup.

Discussion

This project’s strongest property is that it forces a clean interface between hardware intent and software representation. The processor design is small enough that I can reason about every signal transition, but complete enough to exercise real co-design constraints: instruction encoding decisions affect decode logic; decode logic constrains what the assembler must emit; and the ROM loading workflow becomes part of the “system contract,” not a separate afterthought.

That said, the absence of a testbench is a real limitation. Interactive waveform inspection is effective for bring-up and learning, but it does not scale to repeatable regression. Without an automated test harness, it is easy to introduce subtle contract drift for example, changes in instruction bit layout, operand field meaning, or zero-flag conventions without immediately noticing. The README asserts that the assembler “supports all implemented instructions,” but the current Conversion.py opcode table only enumerates Load, ADD, SUB, and JNZ, and it encodes operands into fixed 2-bit (register) and 4-bit (immediate) fields, which may or may not match the 7-bit instruction format you ultimately used in ROM. In a co-design project, this kind of mismatch is common and also instructive but it is worth surfacing as a deliberate boundary to tighten.

The architectural constraints are also doing real work here. The 7-bit width means arithmetic overflow is not an edge case; it is a normal mode of operation, and truncation becomes the implicit overflow policy. The ROM-based memory model similarly compresses the problem: by treating “program and data” as a static table, I avoid a full load/store subsystem and can focus on sequencing and datapath correctness. The cost is that the system is simulation-oriented, and “loading a program” is effectively editing VHDL. For the stated educational goal, that trade-off is reasonable, but it is the first thing I would change if I wanted this design to behave more like a reusable platform.

What I would tighten next

If I were evolving this beyond a learning artifact, I would prioritize three reliability-oriented improvements:

  1. Lock the instruction contract: define a single authoritative bit layout (fields, widths, and operand meaning) and make the VHDL decode and the Python assembler share it (even if only by generating a common table/module).
  2. Add a minimal self-checking testbench: one or two short programs with assertions on PC/register end state would turn interactive validation into repeatable regression.
  3. Separate program data from RTL: move ROM initialization into a file-based mechanism supported by the simulator (or at least generate Memory.vhd program blocks automatically from the assembler output) to reduce manual copy/paste drift.

Conclusion

I built this 7-bit processor as a compact hardware–software co-design exercise: a minimal ISA, a VHDL implementation with a clear separation between datapath and control, and a Python assembler that translates human-readable instructions into ROM-ready binary. The design is intentionally constrained 7-bit width, ROM-based memory, and a small instruction set so that the full fetch–decode–execute behavior remains understandable in simulation. Within that scope, the project demonstrates the engineering mechanics that matter in larger systems: defining module contracts, sequencing state updates cleanly, and keeping the software encoding pipeline consistent with hardware decode expectations.

The next step, if I want to make it more robust, is not to add features first; it is to formalize the instruction-format contract and add a minimal self-checking testbench so that the co-design boundary becomes repeatable and verifiable rather than primarily manual.

References

[1] S. Sojudi Abdee Fard, “7-Bit Custom Processor Design for Hardware-Software Co-Design,” GitHub repository (semester 8 / 7-Bit Custom Processor Design). https://github.com/sabers13/bachelor-projects/tree/main/semester%208/7-Bit%20Custom%20Processor%20Design

[2] IEEE Standards Association, “IEEE 1076-2019 IEEE Standard for VHDL Language Reference Manual,” Dec. 23, 2019. https://standards.ieee.org/ieee/1076/5179/

[3] Advanced Micro Devices, Inc., Vivado Design Suite User Guide: Logic Simulation (UG900), v2024.2, Nov. 13, 2024.https://docs.amd.com/r/2024.2-English/ug900-vivado-logic-simulation

[4] Siemens EDA, “ModelSim User’s Manual,” software version 2024.2 (PDF). https://ww1.microchip.com/downloads/aemDocuments/documents/FPGA/swdocs/modelsim/modelsim_user_2024_2.pdf

[5] Python Software Foundation, “Python 3 Documentation,”. https://docs.python.org/

ArchiCAD vs Revit

“ArchiCAD vs Revit: In-Depth Comparison of Features and Applications for BIM”

Estimated Reading Time: 9 minutes

Summary
“ArchiCAD vs Revit: In-Depth Comparison of Features and Applications for BIM”

In this article, a comprehensive comparison between two prominent software in the field of architectural design and construction engineering, ArchiCAD and Revit, was conducted. Each of these software tools has its own unique features and capabilities that make them suitable for various types of projects. ArchiCAD, with its simpler user interface and freehand design capabilities, is a great choice for architects with less experience. On the other hand, Revit, with its advanced parametric modeling tools and ability to handle complex projects, is better suited for engineers and architects working on larger-scale projects.

Ultimately, the choice between these two software depends on the specific needs of the project and the user’s level of expertise. This article helps you make a better-informed decision when selecting the right software for your projects.

Author: Hamed Salimian
Here’s a suggested table of contents for your article on the comparison between ArchiCAD and Revit:

Table of Contents

  1. Introduction
    • Overview of ArchiCAD and Revit
    • Importance of BIM Software in Architecture and Engineering
  2. History and Background
    • ArchiCAD: Origins and Development
    • Revit: Origins and Development
  3. User Interface Comparison
    • ArchiCAD Interface: Simplicity and Usability
    • Revit Interface: Complexity and Customization
  4. BIM Features and Capabilities
    • ArchiCAD’s BIM Tools
    • Revit’s BIM Tools
  5. Modeling and Design Features
    • ArchiCAD’s Design Flexibility
    • Revit’s Parametric Modeling
  6. Energy Simulation and Performance Analysis
    • ArchiCAD’s Energy Simulation Tools
    • Revit’s Energy Analysis Capabilities
  7. Collaboration and File Compatibility
    • ArchiCAD’s Compatibility with Other Software
    • Revit’s Integration with Autodesk Ecosystem
  8. Advantages and Disadvantages
    • ArchiCAD’s Strengths and Weaknesses
    • Revit’s Strengths and Weaknesses
  9. Use Case Scenarios
    • When to Choose ArchiCAD
    • When to Choose Revit
  10. Conclusion
    • Final Thoughts on Choosing Between ArchiCAD and Revit
  11. Author’s Note
    • A Brief About the Author: Hamed Salimian

Introduction

In the world of architectural design and construction engineering, there are numerous software tools for Building Information Modeling (BIM) that assist designers, architects, and engineers in streamlining the design and construction processes. Two prominent software in this field are ArchiCAD and Revit. Each of these software tools has its own unique features and capabilities, which can significantly impact the design and construction workflow of projects.

This article will provide an in-depth comparison between ArchiCAD and Revit. The comparison will be based on the features, capabilities, advantages, disadvantages, and applications of these software tools to help architects, engineers, and designers make the best choice for their specific needs.
History and Background of the Software

ArchiCAD
ArchiCAD, developed by Graphisoft, was first released in 1984 and has since become one of the most important architectural design software tools. Initially, the software was recognized as a tool for 2D and 3D design, but over time, it evolved into an advanced Building Information Modeling (BIM) software. As one of the pioneers of BIM, ArchiCAD provides powerful tools for architectural design, building information modeling, energy simulation, and the production of construction documentation.

Revit
Revit is another software in the field of Building Information Modeling, developed by Autodesk. First released in 2000, it quickly became one of the most widely used BIM software tools in the architecture, engineering, and construction industries. Revit is built on the concepts of “parameters” and “information modeling,” offering the ability to generate highly accurate and editable 3D models.
Feature Comparison

User Interface

ArchiCAD:
The user interface of ArchiCAD is simpler and more intuitive compared to Revit. This software is better suited for individuals who are looking for a user-friendly environment and a “drag-and-drop” design approach. The tools and windows in ArchiCAD are designed to be straightforward and easy to use.

Revit:
Revit’s user interface is relatively more complex. It allows users to utilize more advanced tools for designing and managing projects. While Revit may initially be confusing for beginners, over time, as users become more familiar with the software, they can fully benefit from its capabilities.

Modeling and BIM Features

ArchiCAD:
As one of the first BIM-based software tools, ArchiCAD offers powerful features for building modeling, documentation creation, energy simulation, and building information management. One of ArchiCAD’s standout features is the GDL (Geometric Description Language) tool, which allows designers to create custom objects and components that can be added to the BIM model.

Revit:
Revit is more widely used in larger and more complex projects due to its advanced parametric modeling features. This software allows different sections of the model to be connected parametrically, so any change in one section automatically updates other related sections. This feature makes Revit much more effective for larger, more complex projects.

Compatibility with Other Software

ArchiCAD:
ArchiCAD is fully compatible with other software and supports a variety of formats, including IFC, DWG, and DXF. It can easily integrate with other BIM and design software such as Rhino and SketchUp.

Revit:
Revit also offers high compatibility with other software, especially Autodesk products such as AutoCAD and 3ds Max. It supports file formats like IFC, DWG, and DXF. One of Revit’s key advantages is its integration with other software within the Autodesk suite, which is very useful for users working in the Autodesk ecosystem.
Features and Capabilities Analysis

Design and Modeling

ArchiCAD:

ArchiCAD has the ability to design complex models with advanced modeling tools and supports parametric modeling. This software allows designers to create precise and complete 3D models and also enables complex interactions between different components and sections of the model. One of ArchiCAD’s unique features is the use of freeform design tools, which allow users to carry out their designs with more precision and flexibility. This feature allows architects and designers to create accurate, complex, and custom designs that require fewer changes or adjustments.

ArchiCAD also offers tools for modeling complex geometric volumes, enabling designers to design and view different parts of the building in a three-dimensional environment simultaneously. Additionally, the GDL (Geometric Description Language) tool enables the creation and use of custom objects, allowing designers to design specific parts and easily add them to BIM models.

Revit:

Revit is highly popular due to its powerful parametric design and modeling capabilities. This software is more focused on modeling structures, installations, and systems, offering highly accurate and advanced design tools. Revit is designed based on parameters, which enables precise and flexible model creation. It allows automatic updates across the model when changes are made to any section, ensuring that design revisions are easily and accurately reflected throughout the project.

Revit provides tools for designing HVAC systems, plumbing, electrical systems, and other building utilities, allowing users to perform highly detailed and complex designs. Since Revit is designed to handle larger and more complex projects, its features in information management, precise modeling, and process simulation make it an excellent tool for commercial and government projects.

One of Revit’s key features is the ability to connect all parts of the model parametricly. This feature not only allows designers to manage architectural and structural models simultaneously but also ensures automatic updates across various project elements, improving accuracy and efficiency in large projects.

Energy Simulation and Building Performance

ArchiCAD:


ArchiCAD vs Revit

When it comes to designing energy-efficient buildings, ArchiCAD vs Revit is a frequent debate among architects and sustainability experts. Both platforms offer robust tools for environmental simulation, but they approach energy performance in different ways. ArchiCAD provides intuitive and integrated tools for simulating energy consumption, daylight analysis, and natural ventilation. It allows users to model how various environmental conditions—such as solar radiation, wind, and temperature—affect building performance. With ArchiCAD, architects can quickly assess how design changes impact energy efficiency and receive suggestions for optimization.

On the other hand, Revit also offers strong energy modeling capabilities, especially when used in combination with Autodesk Insight. Revit focuses on detailed Building Information Modeling (BIM) and integrates with analysis tools to evaluate energy usage, carbon footprint, and thermal comfort. However, ArchiCAD vs Revit in terms of ease of use and native sustainability tools often shows that ArchiCAD has a simpler and more architect-friendly interface for quick analysis.

Ultimately, when comparing ArchiCAD vs Revit, the choice depends on project needs. For projects where energy simulation is a priority from early design stages, ArchiCAD provides a smoother, more focused experience. Yet, both tools support the goal of creating high-performance, sustainable buildings.


Revit:

Revit also offers a wide range of energy simulation and environmental analysis tools, particularly when integrated with powerful add-ons like Autodesk Insight. One of Revit’s key strengths is its ability to model and analyze complex building systems such as HVAC (Heating, Ventilation, and Air Conditioning), energy consumption, and overall performance. This makes it a top choice for engineers and multidisciplinary teams working on technically demanding projects.

When comparing ArchiCAD vs Revit, it’s clear that Revit excels in system-level modeling, while ArchiCAD offers a more streamlined interface for architects focused on design and sustainability. Revit enables users to model natural airflow, internal temperature changes, and perform detailed calculations related to building energy use. This allows designers to optimize HVAC systems and improve thermal comfort across different zones in a building.

However, in the ArchiCAD vs Revit discussion, ArchiCAD remains strong in early-stage energy analysis, daylight optimization, and ventilation planning. While Revit is highly customizable and data-driven, ArchiCAD often wins when simplicity and design integration are essential.

Overall, the ArchiCAD vs Revit comparison comes down to project priorities—Revit for systems modeling, and ArchiCAD for architectural energy efficiency.

Advantages and Disadvantages

Advantages of ArchiCAD:

  1. Simpler and More User-Friendly Interface:
    One of the biggest advantages of ArchiCAD is its user-friendly interface, which is ideal for architects with less experience in using BIM software. The software is designed with simple and easy-to-understand graphic principles, making it quicker to learn and operate.
  2. Freeform Design Tools:
    ArchiCAD offers significant tools for freeform and creative design. This feature allows designers to create unique and highly detailed models, adjusting and improving their designs with ease.
  3. Stable and Faster Performance:
    ArchiCAD generally performs faster than Revit in terms of data processing and project execution. This is particularly beneficial in small to medium-sized projects where speed is important.

Disadvantages of ArchiCAD:

  1. Limited Parametric Capabilities:
    While ArchiCAD supports parametric modeling, it is not as advanced as Revit in this area. Changes in various parts of the model in ArchiCAD are not automatically reflected across the entire project, requiring more manual intervention.
  2. Less Compatibility with Other BIM Software:
    While ArchiCAD supports various file formats, its compatibility with other BIM software is not as extensive as that of Revit. This can be a limitation in projects that require frequent data exchange with other BIM tools.

Advantages of Revit:

  1. Advanced and Parametric Tools:
    Revit’s biggest advantage lies in its advanced parametric modeling capabilities. The software enables designers to connect all components of the model parametrically, ensuring automatic updates across the project when any part is modified.
  2. Compatibility with Autodesk Software:
    Revit integrates seamlessly with other Autodesk tools such as AutoCAD and 3ds Max. This integration allows for greater project coherence and ensures that designers can benefit from a unified software ecosystem.
  3. High Precision in Systems and Structural Design:
    Revit excels at modeling building systems and structures with high precision. This is particularly beneficial in larger projects that require careful coordination and detailed design of systems and components.

Disadvantages of Revit:

  1. Complex User Interface:
    One of the main drawbacks of Revit is its complex user interface. Beginners may find it challenging to learn and navigate the software, which can result in increased learning time and reduced productivity during the initial stages of use.
  2. Higher Hardware Requirements:
    Revit typically requires more powerful hardware for optimal performance. This can be a challenge for users with older machines, especially when working on larger, more complex projects that demand high processing power.

Conclusion

Both ArchiCAD and Revit offer powerful and advanced tools that are useful for different types of projects. ArchiCAD is better suited for architects with less experience and for small to medium-sized projects where freeform design and user-friendly interfaces are critical. On the other hand, Revit is more efficient for larger and more complex projects, particularly in the areas of parametric design, system modeling, and information management. The choice between these two software solutions ultimately depends on the specific needs of the project and the expertise of the user.

revit

“Revit in Complex Construction Projects: Key Features, Challenges, and Solutions for Effective BIM Implementation”

Estimated Reading Time: 16 minutes

revit

Table of Contents

  1. Introduction
    1.1. Overview of Revit and its Role in Complex Construction Projects
    1.2. Purpose and Scope of the Article
  2. BIM and Revit Overview
    2.1. Definition and Concept of BIM
    2.2. What is Revit?
    2.3. Key Features of Revit in Complex Construction Projects
    – 3D Modeling for Accurate Design
    – Coordination and Collaboration in Real-Time
    – Data Management for Cost, Time, and Quality Control
    – Simulation and Performance Analysis
    – Change Management in Design and Construction
  3. Challenges and Solutions in Using Revit
    3.1. Challenges of Using Revit
    – Need for High-Level Training and Technical Skills
    – High Initial Costs
    – Need for Precise Team Coordination
    – Data and Information Management Challenges
    3.2. Solutions for Overcoming Challenges
    – Training and Skill Enhancement for Teams
    – Use of Cloud-Based Versions
    – Improved Team Coordination Processes
    – Centralized Data Management
  4. Benefits of Revit in Managing Complex Projects
    4.1. Improved Accuracy and Reduced Errors
    4.2. Enhanced Collaboration and Coordination
    4.3. Time and Cost Savings
    4.4. Better Project Outcomes and Quality
  5. Conclusion
    5.1. Summary of Key Insights
    5.2. The Future of Revit in Complex Construction Projects

Feel free to adjust any section titles or str1.1. Definition and Concept of BIM

Building Information Modeling (BIM) refers to the use of 3D digital models for the design, construction, and management of buildings. In this process, all relevant project information, including design details, scheduling, costs, materials, and the performance of various systems, is collected, stored, and updated digitally.

BIM not only involves creating 3D models of buildings but also serves as a comprehensive system for managing information and data throughout all stages of a construction project. These stages include planning, construction, operation, and maintenance of buildings and infrastructures.

In BIM, all project stakeholders, including architects, engineers, contractors, and project managers, can simultaneously and digitally access project data. These models are continuously updated and allow all information, from design details to mechanical, electrical, plumbing (MEP) systems, and even facility maintenance databases, to be centralized and easily shared. This process significantly enhances project efficiency and accuracy, as all information is available in a comprehensive and up-to-date model.

BIM generally has three core functions:

  1. Modeling and Design: Creating a 3D model and digital representation of the building using various data.
  2. Information Management: Storing and updating all project data in a centralized database.
  3. Analysis and Simulation: Simulating building performance in the real world, including energy analysis, structural analysis, and system behaviors.

Ultimately, BIM not only makes the design and construction process more efficient but also aids in managing complex projects, reducing costs and unnecessary delays. Additionally, this technology improves design accuracy, decision-making, and minimizes the need for revisions throughout construction projects.


1.2. What is Revit?

Revit is a BIM software developed by Autodesk. This software is specifically designed for architects, structural engineers, MEP engineers, and contractors, providing them with tools for 3D modeling, structural analysis, project management, and cost control.

The main goal of Revit is to provide an environment for collaboration and coordination among all project team members. Unlike older software, which only focused on 2D drawing, Revit allows users to create accurate and realistic 3D models of building projects. These models not only include architectural designs but also encompass all structural systems, MEP systems, and other project details.

Key features of Revit include:

  • Parametric Modeling: Meaning changes in one part of the model automatically update all related sections.
  • Structural and Energy Analysis: Offering capabilities to analyze the performance of building systems, energy consumption, and structural integrity.
  • Information and Data Management: Revit enables all project data, including plans, cost estimates, and schedules, to be stored and managed in a central model.

Revit also allows real-time collaboration, meaning that project teams can work on a shared model at the same time, keeping everything up-to-date. This feature reduces errors and facilitates the management of complex construction projects. Revit is an indispensable tool for designers, engineers, and project managers, improving collaboration and coordination between different teams while enhancing project accuracy.


1.3. Key Features of Revit in Managing Complex Construction Projects

3D Modeling for More Accurate Design

One of the main features of Revit is its ability to create precise 3D models of buildings and installations. These models include not only architectural designs but also all structural, mechanical, electrical, and plumbing (MEP) systems. This enables all project team members to have a more accurate representation of the project and identify potential issues before they arise.

Real-Time Team Coordination and Collaboration

Revit allows designers, engineers, and contractors to work on a shared model in real time. This feature ensures that all changes are updated instantly, and everyone on the team is aware of the latest information. In complex projects, this real-time collaboration helps prevent errors and ensures the smooth flow of information between all parties involved.

Data Management and Analysis for Cost, Time, and Quality Control

Revit provides tools for data management and analysis, allowing project managers to control costs, schedules, and quality. Features like scheduling tools, cost estimation, and reporting help monitor and manage the project effectively. These capabilities allow project managers to steer the project in the right direction and avoid unnecessary delays or costs.

Simulation and Analysis of Building System Performance

Revit enables users to simulate the performance of different systems within the building, such as energy systems, HVAC, and plumbing systems. This feature helps engineers assess the efficiency of these systems before construction begins and make necessary adjustments to optimize performance and energy use.

Managing Changes in Design and Construction

One of the biggest challenges in complex construction projects is managing changes. Revit is designed to automatically update the entire model whenever changes are made. This ensures that all team members are working with the most current version of the model and that changes are implemented across the project without issues.

By offering these key features, Revit serves as a powerful tool for managing complex construction projects, enabling teams to work more efficiently, reduce errors, and ensure the project stays on schedule and within budget.

1.2. What is Revit?

Revit is a BIM-based (Building Information Modeling) design software developed by Autodesk. This software is specifically designed for architects, structural engineers, MEP (Mechanical, Electrical, and Plumbing) engineers, and contractors, providing tools for 3D modeling, structural analysis, scheduling, project management, and cost control.

The primary goal of Revit is to provide an integrated platform for all project team members to collaborate and coordinate. Unlike older software, which only focused on creating 2D drawings, Revit allows users to create accurate and realistic 3D models of building projects. These models include not just architectural designs but also all structural systems, mechanical, electrical, plumbing (MEP) systems, and other project details. This comprehensive approach enables all project stakeholders to work within a shared model, improving collaboration and coordination.

Revit has several unique features that make it an invaluable tool for teams involved in design, engineering, and construction management. Let’s explore the key features and functionalities of Revit that help streamline the design and construction processes, especially in complex building projects.

Key Features of Revit:

  1. Parametric Modeling:
    One of the most powerful features of Revit is parametric modeling. This means that changes made to one part of the model automatically update all related sections of the model. For example, if you change the dimensions of a wall, all associated views, sections, and drawings are automatically updated. This ensures consistency across the project and reduces errors related to manual updates.
  2. Structural and Energy Analysis:
    Revit provides advanced tools for structural analysis and energy modeling. Engineers can simulate how the building will behave under various loads, such as gravity or wind, and analyze the building’s energy performance. This helps in optimizing the design for energy efficiency, sustainability, and compliance with building codes. Structural engineers can use these tools to test the stability of a building before construction starts, ensuring it will withstand forces and stresses.
  3. Data and Information Management:
    One of the key advantages of Revit is its ability to manage all project data within a central model. This includes drawings, cost estimates, schedules, specifications, and more. Since everything is stored in one place, it is easier for the project team to collaborate, track progress, and ensure everyone is working with the most up-to-date information. This centralization also reduces duplication and errors that can occur when team members work on separate documents.
  4. Simulation and Performance Analysis:
    Revit allows for detailed simulation and performance analysis of different building systems, such as HVAC, electrical, and plumbing systems. This feature enables teams to test how these systems will function in real-world conditions and make any necessary adjustments before construction begins. Energy simulations allow for better energy-efficient designs by testing the building’s energy performance and identifying areas for improvement.
  5. Real-Time Collaboration:
    Revit is designed to allow team members to work on a shared model simultaneously. Changes made by one team member are instantly updated for all other members, ensuring that everyone is working with the latest information. This feature is particularly useful for complex projects where multiple disciplines are involved and real-time communication is essential. It ensures that any design changes, adjustments, or updates are communicated clearly and efficiently, preventing errors that could arise from outdated or conflicting information.
  6. Managing Changes in Design and Construction:
    In large projects, managing changes in the design can be one of the most challenging tasks. Revit addresses this by enabling automatic updates across all related sections of the project when changes are made. This ensures that all project stakeholders are working with the most current version of the design and prevents discrepancies between drawings, models, and specifications. With Revit, the process of updating a project is streamlined, allowing teams to handle design changes efficiently.
  7. Project Management and Scheduling:
    Revit also includes tools for project management and scheduling. It integrates with scheduling software to help teams track project timelines, milestones, and deliverables. By linking the 3D model with time-based data, project managers can visualize the construction process and ensure that the project stays on track. This helps to identify any potential delays early and allows for adjustments to be made before problems arise.

In summary, Revit is not just a tool for creating 3D models but also a comprehensive software suite that helps manage the entire construction process, from design and coordination to project management and cost control. By integrating BIM with features like parametric modeling, real-time collaboration, and structural and energy analysis, Revit has become an indispensable tool for architects, engineers, contractors, and project managers. It enhances collaboration, reduces errors, improves design accuracy, and ultimately contributes to the successful completion of complex building projects.

3.1. Challenges of Using Revit in Complex Projects

The use of Revit in complex construction projects can come with various challenges. While Revit is a powerful BIM (Building Information Modeling) tool offering numerous benefits, there are several obstacles that teams may face when fully utilizing its capabilities. These challenges can stem from technical aspects, costs, coordination issues, and data management. In this section, we will discuss some of the main challenges that arise when using Revit in complex building projects.

1. The Need for High-Level Training and Technical Skills

One of the primary challenges teams face when adopting Revit is the need for specialized skills. Revit is a sophisticated software that requires a deep understanding of 3D modeling, parametric design, and data management. Many teams may be accustomed to older software, like AutoCAD, which focuses mainly on 2D drawings. However, Revit offers a complete shift to 3D modeling, and teams need to adapt to a more integrated approach to design, coordination, and project management.

The parametric nature of Revit means that changes in one part of the model automatically affect other parts. This feature enhances accuracy, but it also requires users to understand the interconnections within the model. Without proper training, teams may struggle with applying these features effectively, leading to inefficiencies and errors. As Revit is an advanced tool, proper training and technical expertise are critical for maximizing its potential and ensuring that all team members are aligned in their use of the software.

2. High Initial Costs

Another significant challenge is the high initial cost associated with purchasing and implementing Revit. For smaller companies or firms with limited budgets, the cost of purchasing software licenses, installing the software, and providing training can be a considerable financial burden. The Revit software itself can be expensive, especially if a company needs to purchase multiple licenses for different team members.

In addition to the cost of the software, companies must also account for training expenses to ensure that all relevant staff members are proficient in using the software. The initial investment can be prohibitive, especially for small and medium-sized enterprises (SMEs) that may not have the same financial flexibility as larger firms. This challenge is particularly relevant for smaller-scale projects, where the return on investment may not be immediately apparent.

3. The Need for Precise Team Coordination

To fully leverage Revit, precise and continuous coordination among project team members is necessary. Revit works best when all stakeholders—architects, engineers, contractors, and other project participants—are working on a single, shared model. In a complex project, many teams must collaborate across various disciplines, including architectural design, structural engineering, and MEP (mechanical, electrical, and plumbing) systems.

If team members do not collaborate effectively or fail to update the model in real time, errors can arise, and discrepancies between the different design elements may occur. Revit allows for real-time updates and changes, but this system only works effectively if there is clear communication and synchronization between all team members. Without proper coordination, the potential for mistakes increases, and project timelines can be affected.

4. Data and Information Management Challenges

Managing the massive amounts of data generated in complex construction projects can also pose a challenge when using Revit. A single project can generate a significant amount of information, such as design documents, cost estimates, schedules, specifications, and other project-related data. Revit stores all this information in one central model, but ensuring that the data is properly managed and regularly updated can become difficult, especially when dealing with larger-scale projects.

Without proper data management practices, projects can suffer from inconsistent information, outdated models, or communication breakdowns. This leads to inefficiencies and potential errors that can affect the overall success of the project. Moreover, managing the flow of information from various sources and ensuring that each team member has access to the correct, up-to-date data is essential for maintaining a smooth workflow.


3.2. Solutions

1. Training and Skill Enhancement for Teams

To make the most out of Revit and BIM (Building Information Modeling), specialized training and advanced courses for project team members are essential. Many of the issues teams face when using Revit stem from a lack of familiarity with the software and its advanced features. Proper training can help teams familiarize themselves with key features such as parametric modeling, real-time collaboration, energy analysis, and data management.

Companies should invest in regular training programs for their staff to ensure that everyone is proficient in using Revit. Continuous education will help the team stay updated on new features and functionalities of the software. Additionally, specialized training for architects, engineers, contractors, and other stakeholders will ensure that they fully understand the capabilities of Revit and how to best apply it in their roles.

2. Use of Cloud-based Versions

One solution to overcome the challenges of cost and data management is the use of cloud-based versions of Revit. Cloud-based Revit versions allow teams to access project data and models remotely, ensuring that all members of the team have real-time access to the most current information. This makes it easier for teams to collaborate, especially when working on large or international projects where team members may be in different locations.

The cloud-based approach also eliminates the need for expensive software installations and maintenance. Teams can access the Revit model from any device with internet access, allowing for greater flexibility and convenience. Cloud-based versions of Revit also provide automatic data synchronization, ensuring that all team members are working with the latest version of the model, thus reducing errors and improving efficiency.

3. Improved Team Coordination Processes

Another solution to enhance the effectiveness of Revit is to improve team coordination processes. Project managers should establish clear guidelines for communication, data sharing, and model updates. Tools like Slack, Microsoft Teams, and Trello can facilitate communication and project management. Additionally, regular coordination meetings should be scheduled to ensure that everyone is on the same page and to address any issues before they become major problems.

Using collaborative tools in conjunction with Revit can help ensure that all stakeholders are aware of the latest updates, changes, and project statuses. Project managers should also implement shared calendars and alert systems to help teams stay on track and meet deadlines.


In conclusion, to make the most of Revit in complex construction projects, addressing challenges such as training, high costs, team coordination, and data management is essential. By investing in specialized training, using cloud-based solutions, and improving team collaboration, companies can overcome these challenges and fully leverage the power of Revit. These strategies will help improve the efficiency, accuracy, and success of complex building projects, leading to more successful project outcomes and better overall management.

Section 3: Challenges and Solutions in Using Revit for Complex Projects

3.1. Challenges of Using Revit

Using Revit in complex construction projects can present several challenges. While Revit is a powerful BIM (Building Information Modeling) tool offering numerous benefits, there are various obstacles that teams may face when fully utilizing its capabilities. These challenges may arise from technical limitations, costs, coordination issues, and data management. In this section, we will discuss some of the main challenges associated with using Revit in complex building projects.

1. The Need for High-Level Training and Technical Skills

One of the most prominent challenges teams face when adopting Revit is the need for specialized skills. Revit is a sophisticated software that requires a deep understanding of 3D modeling, parametric design, and data management. Many teams may be used to older software like AutoCAD, which focuses primarily on 2D drawings. However, Revit introduces a full shift to 3D modeling, requiring a more integrated approach to design, coordination, and project management.

The parametric nature of Revit means that changes made in one part of the model automatically affect other related sections. While this feature increases accuracy, it also requires users to understand the relationships within the model. Without proper training, teams may struggle to effectively utilize these features, leading to inefficiencies and errors. As Revit is an advanced tool, proper training and technical expertise are critical to maximizing its potential and ensuring that all team members are aligned in their use of the software.

2. High Initial Costs

Another significant challenge is the high initial cost of purchasing and implementing Revit. For smaller companies or firms with limited budgets, the costs associated with purchasing software licenses, installing the software, and providing training can be a considerable financial burden. The Revit software itself can be expensive, especially if a company needs to buy multiple licenses for different team members.

In addition to the software cost, companies also need to factor in training expenses to ensure that relevant staff members are proficient in using the software. The initial investment can be prohibitive, particularly for small and medium-sized enterprises (SMEs), which may not have the financial flexibility of larger firms. This challenge is particularly relevant for small-scale projects, where the return on investment may not be immediately apparent.

3. The Need for Precise Team Coordination

To fully leverage Revit, precise and continuous coordination among project team members is necessary. Revit works best when all stakeholders—architects, engineers, contractors, and other project participants—are working on a shared model. In a complex project, multiple teams must collaborate across various disciplines, including architectural design, structural engineering, and MEP (mechanical, electrical, and plumbing) systems.

If team members do not collaborate effectively or fail to update the model in real-time, errors can arise, and discrepancies between design elements may occur. Revit allows for real-time updates and changes, but this system only works effectively if there is clear communication and synchronization between all team members. Without proper coordination, mistakes are more likely, and project timelines can be negatively affected.

4. Data and Information Management Challenges

Managing the massive amounts of data generated in complex construction projects can also pose a challenge when using Revit. A single project can generate significant volumes of information, such as design documents, cost estimates, schedules, specifications, and other project-related data. Revit stores all this information in a central model, but ensuring that the data is properly managed and regularly updated can become difficult, especially when working on larger-scale projects.

Without proper data management practices, projects can suffer from inconsistent information, outdated models, or communication breakdowns. This leads to inefficiencies and potential errors that can affect the overall success of the project. Furthermore, managing the flow of information from various sources and ensuring that each team member has access to the correct, up-to-date data is crucial for maintaining a smooth workflow.


3.2. Solutions

1. Training and Skill Enhancement for Teams

To maximize the potential of Revit and BIM (Building Information Modeling), specialized training and advanced courses for project team members are essential. Many of the issues teams face when using Revit stem from unfamiliarity with the software and its advanced features. Proper training can help teams get acquainted with key features such as parametric modeling, real-time collaboration, energy analysis, and data management.

Companies should invest in regular training programs for their staff to ensure that everyone is proficient in using Revit. Continuous education will help the team stay updated on new features and functionalities of the software. Additionally, specialized training for architects, engineers, contractors, and other stakeholders will ensure they fully understand the capabilities of Revit and how best to apply it in their roles.

2. Use of Cloud-Based Versions

One solution to overcome the challenges of cost and data management is the use of cloud-based versions of Revit. Cloud-based Revit versions allow teams to access project data and models remotely, ensuring that all members of the team have real-time access to the most current information. This makes it easier for teams to collaborate, especially on large or international projects where team members may be in different locations.

The cloud-based approach also eliminates the need for expensive software installations and maintenance. Teams can access the Revit model from any device with internet access, allowing for greater flexibility and convenience. Cloud-based versions of Revit also provide automatic data synchronization, ensuring that all team members are working with the latest version of the model, thus reducing errors and improving efficiency.

3. Improved Team Coordination Processes

Another solution to enhance the effectiveness of Revit is to improve team coordination processes. Project managers should establish clear guidelines for communication, data sharing, and model updates. Tools like Slack, Microsoft Teams, and Trello can facilitate communication and project management. Additionally, regular coordination meetings should be scheduled to ensure everyone is on the same page and to address any issues before they become major problems.

Using collaborative tools in conjunction with Revit can help ensure that all stakeholders are aware of the latest updates, changes, and project statuses. Project managers should also implement shared calendars and alert systems to help teams stay on track and meet deadlines.


In conclusion, to fully take advantage of Revit in complex construction projects, addressing challenges such as training, high costs, team coordination, and data management is essential. By investing in specialized training, using cloud-based solutions, and improving team collaboration, companies can overcome these challenges and fully leverage the power of Revit. These strategies will improve the efficiency, accuracy, and success of complex building projects, leading to better overall management and project outcomes.ucture depending on your actual document content.

Revolutionizing Construction: 7 Powerful Ways AI and BIM Integration Are Transforming the Industry

Revolutionizing Construction: 7 Powerful Ways AI and BIM Integration Are Transforming the Industry

Estimated Reading Time: 10 minutesThis article presents an in-depth exploration of the integration of Artificial Intelligence (AI) and Building Information Modeling (BIM) as a transformative force in the construction industry. It highlights how machine learning algorithms, IoT systems, and generative design are redefining traditional BIM workflows—shifting from static digital modeling to dynamic, predictive, and self-optimizing systems. Key applications include automated clash detection, predictive maintenance, energy efficiency modeling, and real-time construction monitoring using drones and sensors. The paper addresses technical challenges such as data interoperability and workforce upskilling while showcasing global case studies that demonstrate measurable improvements in cost, safety, and operational efficiency. Ultimately, the article argues that AI and BIM integration marks a new paradigm—essential for achieving intelligent infrastructure and competitive advantage in a data-driven construction future.