Einleitung
Techniker im Bauwesen in Österreich ist ein gefragtes Berufsprofil auf dem österreichischen Arbeitsmarkt. Der Bausektor gehört zu den wichtigsten wirtschaftlichen Bereichen des Landes und bietet stabile Beschäftigungsmöglichkeiten. Aufgrund der kontinuierlichen Entwicklung von Infrastrukturprojekten, Wohnbau, Straßenbau und Verkehrsnetzen steigt der Bedarf an qualifizierten Fachkräften kontinuierlich an. Ein Techniker im Bauwesen übernimmt dabei eine zentrale Rolle, weil er zwischen Planung, Organisation und praktischer Umsetzung vermittelt.
Die österreichische Bauwirtschaft verzeichnet seit Jahren ein konstantes Wachstum. Laut aktuellen Statistiken trägt die Branche etwa 7% zum Bruttoinlandsprodukt bei und beschäftigt über 400.000 Menschen. Diese Entwicklung schafft einen dauerhaften Bedarf an Fachkräften, insbesondere im Bereich der technischen Baubegleitung. Wer sich für eine Karriere als Techniker im Bauwesen in Österreich interessiert, findet derzeit sehr gute Zukunftsperspektiven und vielfältige Einsatzmöglichkeiten in einem innovativen und zukunftsorientierten Arbeitsumfeld.Author: Hamed Salimian

Berufsbild und Aufgaben eines Technikers im Bauwesen
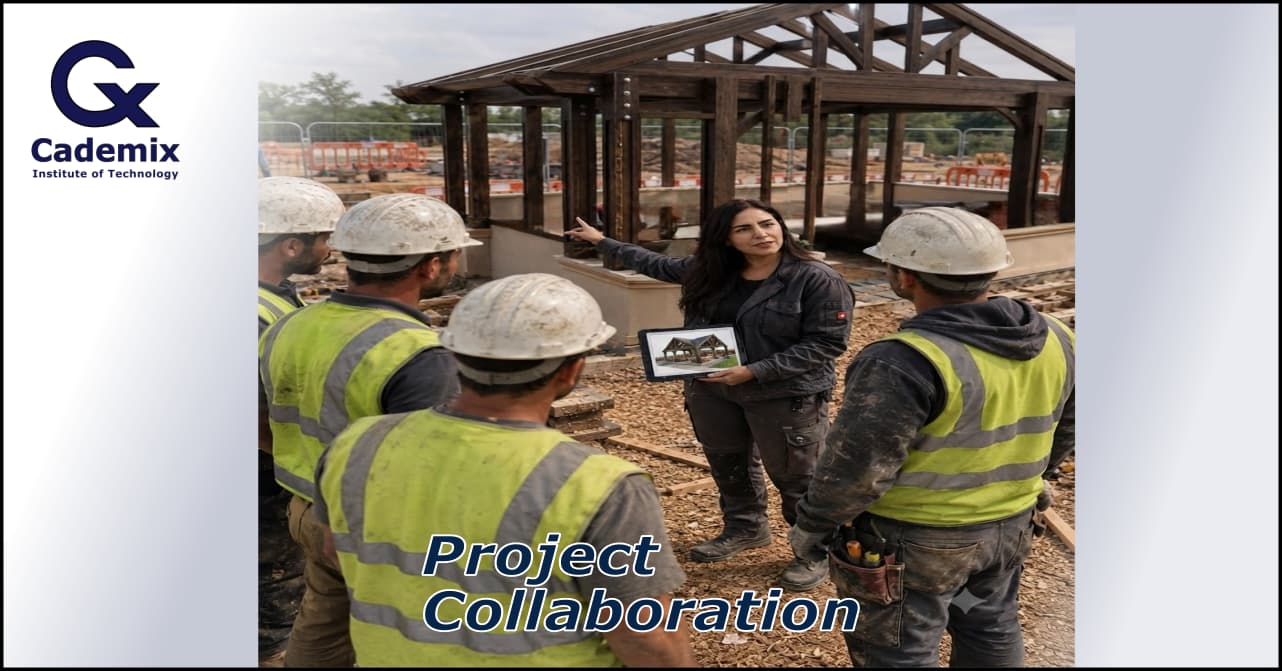
Ein Techniker im Bauwesen in Österreich arbeitet an der entscheidenden Schnittstelle zwischen technischer Planung und praktischer Bauausführung. Während Bauingenieure oft für komplexe Berechnungen, statische Analysen und strategische Projektentwicklung verantwortlich sind, kümmert sich der Techniker um die technische Begleitung, Bauüberwachung und Koordination auf der Baustelle. Diese Position erfordert sowohl fundiertes technisches Wissen als auch ausgeprägte organisatorische Fähigkeiten und exzellente Kommunikationskompetenz.
Die Rolle des Technikers ist besonders wichtig, weil er als Bindeglied zwischen verschiedenen Projektbeteiligten fungiert. Er muss die Sprache der Architekten, Ingenieure, Bauleiter und Handwerker gleichermaßen verstehen und zwischen diesen Gruppen effektiv vermitteln können. Dabei trägt er maßgeblich dazu bei, dass Missverständnisse vermieden werden und alle Beteiligten auf dem gleichen Informationsstand sind.
Detaillierte Aufgabenbereiche
Zu den typischen Aufgaben eines Technikers im Bauwesen in Österreich gehören die Unterstützung bei der Erstellung und Prüfung von Bauplänen, die kontinuierliche Kontrolle von Bauabläufen, die sorgfältige Dokumentation des Baufortschritts sowie die umfassende Überprüfung von Sicherheits- und Qualitätsstandards. Darüber hinaus helfen viele Techniker aktiv bei der präzisen Mengenermittlung und strategischen Materialplanung mit.
Im Detail umfasst dies die Erstellung von Aufmaßen, die Koordination von Lieferanten und Subunternehmern, die Überwachung von Fristen und Budgets sowie die Sicherstellung der Einhaltung aller relevanten Bauvorschriften und Normen. Ein Techniker im Bauwesen in Österreich muss auch in der Lage sein, technische Probleme schnell zu erkennen und pragmatische Lösungen zu entwickeln, bevor kleine Schwierigkeiten zu größeren Projektverzögerungen führen.
- Erstellung, Prüfung und Anpassung technischer Unterlagen und Ausführungspläne
- Kontinuierliche Baustellenüberwachung und systematische Qualitätskontrolle
- Detaillierte Materialermittlung, Mengenberechnung und Kostenkontrolle
- Effektive Koordination mit Bauleitern, Ingenieuren, Architekten und ausführenden Firmen
- Umfassende Dokumentation, regelmäßige Berichterstattung und Fotodokumentation
- Überwachung der Einhaltung von Arbeitssicherheitsvorschriften und Umweltschutzrichtlinien
- Technische Abnahmen und Mängelmanagement
- Unterstützung bei Vergabeverfahren und Ausschreibungen
Wichtige Einsatzbereiche und Spezialisierungsmöglichkeiten
Ein Techniker im Bauwesen in Österreich kann in verschiedenen Fachbereichen tätig sein, die jeweils spezifische Anforderungen und Kenntnisse erfordern.
Hochbau
Im Hochbau konzentriert sich die Arbeit vor allem auf Wohngebäude, Mehrfamilienhäuser, Bürohäuser, Einkaufszentren und Industrieanlagen. Hier sind Kenntnisse in Bereichen wie Statik, Wärmedämmung, Brandschutz und moderne Bautechniken besonders wichtig. Der Techniker im Bauwesen in Österreich im Hochbau überwacht die Errichtung von Rohbauten, koordiniert verschiedene Gewerke und stellt sicher, dass alle bauphysikalischen Anforderungen erfüllt werden.
Tiefbau
Im Tiefbau stehen Straßen, Autobahnen, Brücken, Tunnel, Kanalisationssysteme und Leitungsnetze im Mittelpunkt. Diese Projekte erfordern spezielle Kenntnisse in Bodenmechanik, Vermessung, Entwässerung und Verkehrsplanung. Besonders in Österreich haben Infrastruktur und Verkehrsbau eine große Bedeutung, da kontinuierlich in die Modernisierung und Erweiterung von Autobahnen, Eisenbahnverbindungen und öffentlichen Verkehrsprojekten investiert wird.
Ingenieurbau
Der Ingenieurbau umfasst besonders anspruchsvolle Bauwerke wie große Brücken, Staudämme, Kraftwerke und komplexe Industrieanlagen. Ein Techniker im Bauwesen in Österreich in diesem Bereich arbeitet oft an langfristigen Großprojekten mit hohen technischen Anforderungen und muss eng mit spezialisierten Ingenieuren zusammenarbeiten.
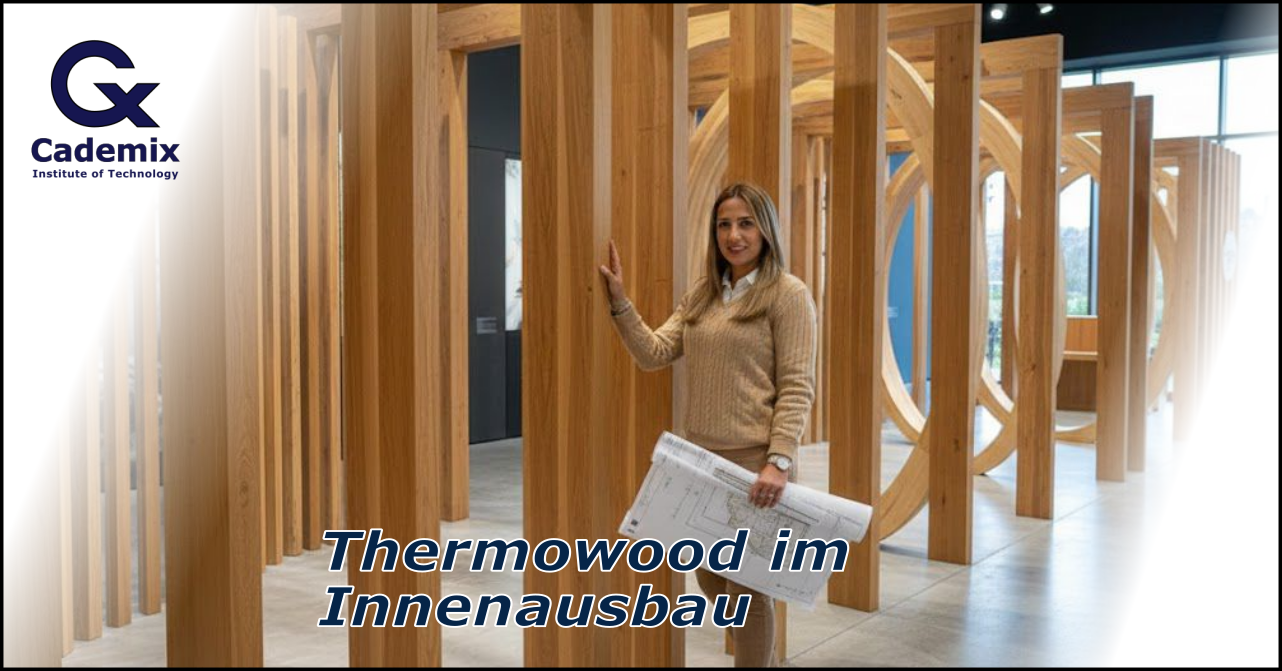
Sanierung und Denkmalpflege
Ein wachsender Bereich ist die Sanierung von Altbauten und die Arbeit mit denkmalgeschützten Gebäuden. Hier sind besondere Kenntnisse über historische Bautechniken, Materialien und spezielle Sanierungsverfahren erforderlich. Österreich verfügt über einen reichen Bestand an historischer Bausubstanz, was diesen Bereich besonders relevant macht.
Ausbildung und Qualifikationen
Für den erfolgreichen Einstieg als Techniker im Bauwesen in Österreich gibt es mehrere bewährte Bildungswege, die unterschiedliche Schwerpunkte setzen und verschiedene Zielgruppen ansprechen.
HTL für Bautechnik
Die Höhere Technische Lehranstalt (HTL) für Bautechnik ist der klassische und am weitesten verbreitete Ausbildungsweg in Österreich. Diese fünfjährige Ausbildung bietet eine praxisnahe und zugleich theoretisch fundierte Ausbildung, die Schüler direkt nach der Matura ins Berufsleben führt. Die HTL vermittelt umfassende Kenntnisse in Baukonstruktion, Statik, Baustoffkunde, CAD-Technik, Projektmanagement und Baurecht.
Absolventen einer HTL sind besonders geschätzt, weil sie bereits während der Schulzeit durch Praktika erste Berufserfahrung sammeln und mit modernen Softwaretools vertraut werden. Nach dem Abschluss können sie direkt als Techniker im Bauwesen in Österreich arbeiten oder ein weiterführendes Studium beginnen.
Fachschule und Kolleg
Für Personen, die bereits eine andere Ausbildung abgeschlossen haben oder einen schnelleren Einstieg suchen, bieten sich Fachschulen oder Kollegs an. Diese Ausbildungsformen dauern zwischen zwei und vier Jahren und konzentrieren sich auf praktische Fähigkeiten und direkt anwendbares Wissen. Ein Kolleg richtet sich speziell an Personen mit Matura, die eine kompakte, intensive Fachausbildung absolvieren möchten.
Hochschulstudium
Ein Studium im Bauingenieurwesen an einer Fachhochschule oder Universität bietet die umfassendste akademische Ausbildung. Studierende erwerben tiefgehende theoretische Kenntnisse in Statik, Massivbau, Stahlbau, Geotechnik und Projektmanagement. Viele Programme beinhalten auch Praktika und Projektarbeiten mit realen Bauvorhaben. Absolventen können als Techniker im Bauwesen in Österreich mit erweiterten Verantwortungsbereichen arbeiten oder direkt in Ingenieurfunktionen einsteigen.
Lehre und duales System
Eine weitere Möglichkeit ist die Lehre zum Bautechnischen Zeichner oder in verwandten Berufen, kombiniert mit weiterführenden Ausbildungen. Dieser Weg eignet sich besonders für praktisch orientierte Personen, die früh ins Berufsleben einsteigen und parallel lernen möchten.
Detaillierte Informationen zu Ausbildungswegen und Lehrberufen finden Sie auf der Website der Wirtschaftskammer Österreich (WKO).
Notwendige Fachkenntnisse und Softwarekompetenzen
Ein moderner Techniker im Bauwesen in Österreich benötigt eine breite Palette an fachlichen und digitalen Kompetenzen, um den Anforderungen des Berufs gerecht zu werden.
CAD und BIM
Die Beherrschung von CAD-Software (Computer-Aided Design) wie AutoCAD, Revit oder ArchiCAD ist unverzichtbar. Zunehmend wichtig wird auch BIM (Building Information Modeling), ein innovativer Ansatz zur digitalen Planung und Verwaltung von Bauwerken. BIM ermöglicht die dreidimensionale Darstellung von Gebäuden mit allen relevanten Informationen und erleichtert die Zusammenarbeit zwischen allen Projektbeteiligten erheblich.
Projektsoftware
Kenntnisse in Projektmanagement-Software wie MS Project, Primavera oder speziellen Baumanagement-Programmen sind sehr hilfreich. Diese Tools unterstützen bei der Terminplanung, Ressourcenverwaltung und Kostenkontrolle.
Vermessung und GIS
Grundkenntnisse in Vermessungstechnik und geografischen Informationssystemen (GIS) werden zunehmend wichtiger, besonders im Tiefbau und bei Infrastrukturprojekten.
Mehr zu digitalen Kompetenzen im Bauwesen finden Sie in unserem Beitrag über Smart Infrastructure und IoT-Monitoring.
Karrierechancen und Gehaltsentwicklung
Der österreichische Arbeitsmarkt zeigt eine konstant hohe und wachsende Nachfrage nach qualifizierten Fachkräften im Bauwesen. Viele Unternehmen – von kleinen regionalen Baufirmen bis zu großen internationalen Baukonzernen – suchen kontinuierlich erfahrene Mitarbeiter für Bauleitung, Projektkoordination und technische Überwachung.
Karrierewege
Ein Techniker im Bauwesen in Österreich kann sich im Laufe der Karriere in verschiedene Richtungen entwickeln:
- Bauleiter: Übernahme der Gesamtverantwortung für einzelne Bauprojekte
- Projekttechniker: Spezialisierung auf technische Projektbegleitung
- Kalkulator: Fokus auf Kostenschätzung und Angebotserstellung
- Spezialist für Infrastrukturprojekte: Expertise in komplexen Tiefbauprojekten
- BIM-Manager: Verantwortung für digitale Planungsprozesse
- Abteilungsleiter: Führung von Teams und Abteilungen
- Selbständigkeit: Gründung eines eigenen Ingenieurbüros oder Bauunternehmens
Gehaltsstruktur
Das monatliche Bruttogehalt für einen Techniker im Bauwesen in Österreich variiert je nach Erfahrung, Verantwortungsbereich, Unternehmensgröße und Region:
- Berufseinsteiger: 2.500 bis 3.200 Euro brutto monatlich
- Mit 3-5 Jahren Erfahrung: 3.200 bis 3.800 Euro
- Mit 5-10 Jahren Erfahrung: 3.800 bis 4.500 Euro
- Senior-Techniker/Bauleiter: 4.500 bis 6.000 Euro und mehr
Besonders in größeren Bauunternehmen, bei Generalunternehmern oder bei komplexen Infrastrukturprojekten sind attraktive Gehälter und zusätzliche Benefits wie Firmenfahrzeug, Bonuszahlungen oder flexible Arbeitsmodelle realistisch. Auch die regionale Komponente spielt eine Rolle: In Wien und den westlichen Bundesländern liegen die Gehälter tendenziell höher als in ländlichen Regionen.
Wichtige Kompetenzen und persönliche Eigenschaften
Neben der fachlichen Qualifikation sind bestimmte persönliche Eigenschaften und Soft Skills entscheidend für den Erfolg als Techniker im Bauwesen in Österreich:
- Technisches Verständnis: Fähigkeit, komplexe technische Zusammenhänge zu erfassen und zu erklären
- CAD- und Software-Kenntnisse: Sicherer Umgang mit modernen Planungs- und Dokumentationstools
- Organisationstalent: Koordination mehrerer Aufgaben, Termine und Projektbeteiligter gleichzeitig
- Team- und Kommunikationsfähigkeit: Effektive Zusammenarbeit mit verschiedenen Gewerken und Hierarchieebenen
- Präzision und Verantwortungsbewusstsein: Genauigkeit bei Messungen, Berechnungen und Dokumentation
- Problemlösungskompetenz: Schnelle und pragmatische Lösungsfindung bei unerwarteten Herausforderungen
- Stressresistenz: Ruhe bewahren bei Zeitdruck und unvorhergesehenen Komplikationen
- Wirtschaftliches Denken: Kostenb ewusstsein und Verständnis für betriebswirtschaftliche Zusammenhänge
- Flexibilität: Anpassungsfähigkeit an wechselnde Arbeitsorte, Projekte und Anforderungen
Herausforderungen im Berufsalltag
Der Beruf des Technikers im Bauwesen in Österreich bringt auch spezifische Herausforderungen mit sich, die bewältigt werden müssen:
Zeitdruck und Termine
Bauprojekte unterliegen oft strengen Zeitplänen und Vertragsstrafen bei Verzögerungen. Techniker müssen in der Lage sein, auch unter Druck präzise zu arbeiten und realistische Lösungen zu finden, wenn Termine gefährdet sind.
Wetterbedingungen
Besonders im Tiefbau und bei Außenarbeiten können Witterungsverhältnisse die Arbeit erheblich beeinflussen. Ein Techniker im Bauwesen in Österreich muss flexibel reagieren und alternative Zeitpläne entwickeln können.
Koordination verschiedener Gewerke
Die gleichzeitige Koordination von Maurern, Elektrikern, Installateuren, Statikern und anderen Fachleuten erfordert diplomatisches Geschick und klare Kommunikation. Konflikte müssen schnell und konstruktiv gelöst werden.
Rechtliche und normative Anforderungen
Die Einhaltung von Bauvorschriften, ÖNORMEN, EU-Richtlinien und Sicherheitsstandards erfordert kontinuierliche Weiterbildung und aktuelles Wissen. Änderungen in Gesetzen und Normen müssen zeitnah umgesetzt werden.
Zukunftstrends und Digitalisierung
Die Baubranche befindet sich in einem tiefgreifenden Wandel, der auch die Rolle des Technikers im Bauwesen in Österreich verändert und erweitert:
Building Information Modeling (BIM)
BIM wird zunehmend zum Standard, besonders bei öffentlichen Aufträgen. Die dreidimensionale, datenbasierte Planung ermöglicht bessere Koordination, weniger Fehler und effizientere Abläufe. Techniker, die BIM beherrschen, haben deutliche Wettbewerbsvorteile.
IoT und Smart Construction
Sensoren auf Baustellen erfassen Daten zu Materialfeuchtigkeit, Temperaturen, Belastungen und Arbeitsfortschritt in Echtzeit. Diese Informationen helfen, Probleme frühzeitig zu erkennen und Prozesse zu optimi…