
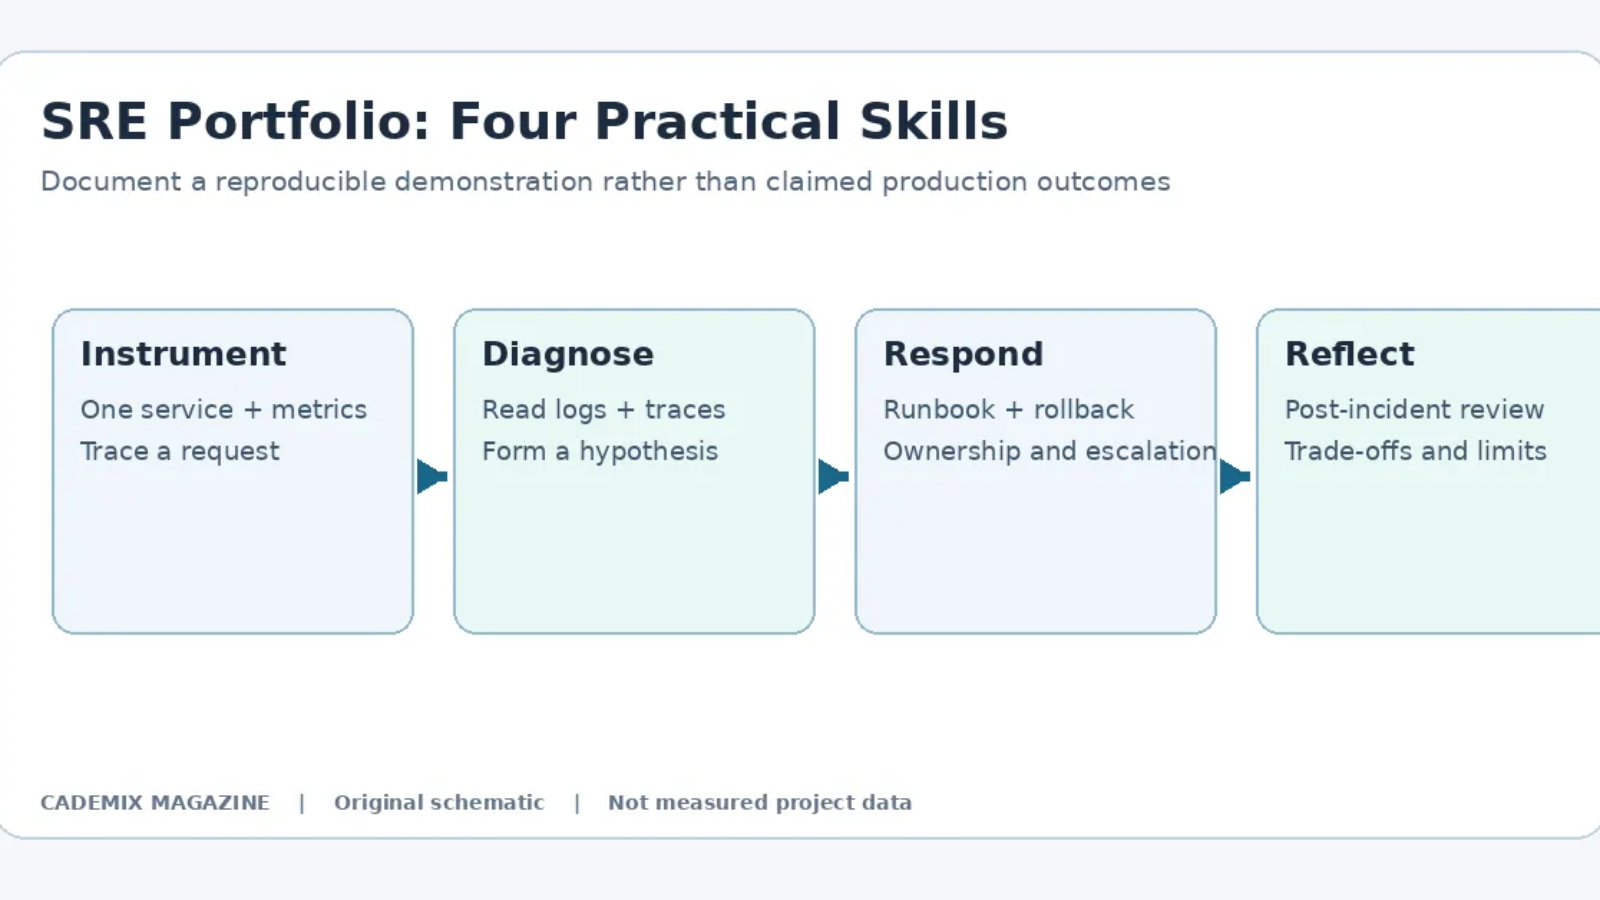
Career Pathway: Becoming a Site Reliability Engineer through Observability in Distributed Systems
Editorial Identifier: CM-0024 Category: Software Engineering & DevOps Angle: Career Advancement
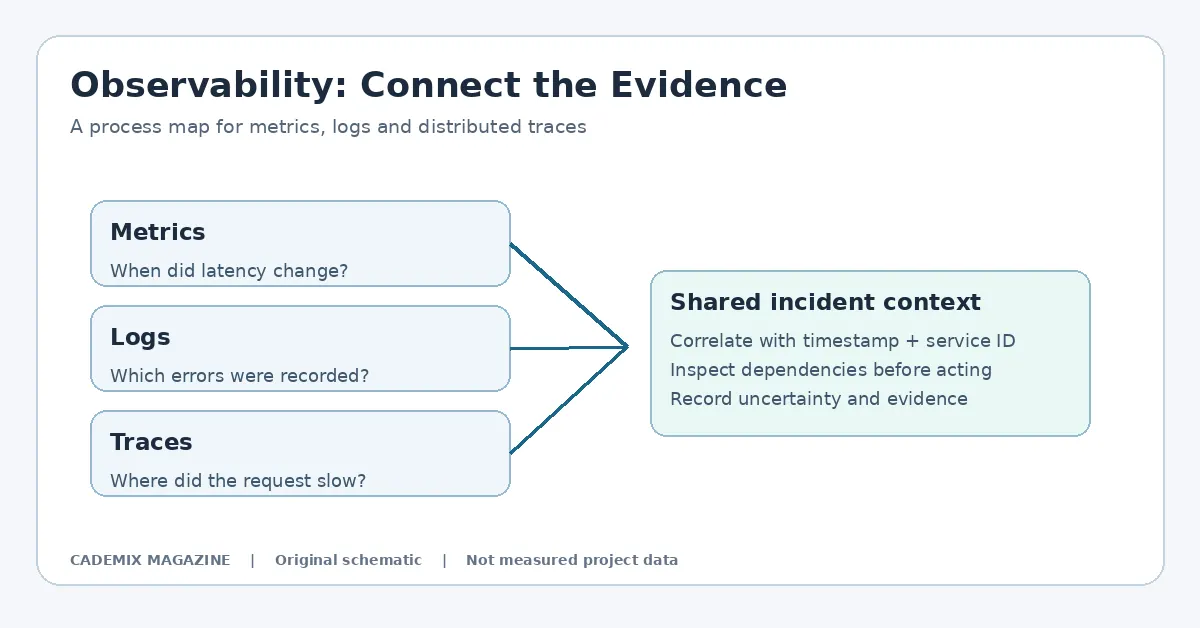
Table of Contents
- The Paradigm Shift: From Monitoring to Observability
- Core Technical Competencies
- 1. Programming and Scripting Proficiency
- 2. Understanding Distributed Tracing
- 3. Metrics Aggregation and Analysis
- 4. Log Structuring and Correlation
- Portfolio Evidence: Building Credibility Without Experience
- Project 1: The Instrumented Microservice Demo
- Project 2: Custom Exporter Development
- Project 3: Chaos Engineering Experiment
- Professional Development Routes
- Route A: The Developer Turnaround
- Route B: The Sysadmin Evolution
- Route C: The Cloud Native Specialist
- Employer Expectations and Interview Dynamics
- The Incident Response Simulation
- Design Questions
- Code Reviews
- Caveats and Common Pitfalls
- The Tooling Obsession
- Ignoring Cost Management
- Neglecting Soft Skills
- Over-Reliance on Managed Services
- Conclusion
- Further reading: Site Reliability Engineer Through Observability
- External reference for further study
The transition from traditional software development or system administration to Site Reliability Engineering (SRE) is no longer merely a lateral move; it is a vertical ascent into one of the most critical roles in modern technology infrastructure. As organizations migrate from monolithic architectures to distributed microservices, the complexity of maintaining uptime and performance has exploded. In this landscape, SREs are not just “ops people who can code”; they are engineers who apply software engineering principles to operational problems.
For students, graduates, and job seekers looking to break into this field, the entry point is often ambiguous. Many candidates focus heavily on automation scripts or cloud certifications, missing the core competency that distinguishes a junior engineer from a true reliability practitioner: Observability. This article outlines a strategic career pathway centered on mastering observability within distributed systems, detailing the necessary skills, portfolio evidence, professional development routes, and employer expectations.
The Paradigm Shift: From Monitoring to Observability
To understand why observability is the key to an SRE career, one must first distinguish it from monitoring. These terms are often used interchangeably in casual conversation, but in an engineering context, they represent fundamentally different approaches to system health.
Monitoring is typically predefined. It answers questions you already know you need to ask. For example, a monitor might alert you when CPU usage exceeds 80% or when HTTP error rates spike above 1%. It relies on known failure modes. If a new type of bug emerges that does not trigger existing alerts, monitoring fails silently.
Observability, conversely, is the ability to infer the internal state of a system by examining its outputs—logs, metrics, and traces—without prior knowledge of the specific failure mode. It allows engineers to answer novel questions about complex, non-deterministic systems. In a distributed architecture where a single user request may touch dozens of services across multiple availability zones, traditional monitoring is insufficient. You cannot predict every possible interaction between services. Therefore, you must build systems that are observable enough to debug unknown unknowns.
For a candidate entering the SRE field, demonstrating proficiency in this distinction is vital. Employers are not looking for someone who can set up a dashboard; they are looking for someone who can design a telemetry pipeline that enables rapid root cause analysis during incidents.
Core Technical Competencies
Building a foundation in SRE requires a blend of coding, infrastructure knowledge, and data literacy. While breadth is important, depth in observability tooling is the differentiator.
1. Programming and Scripting Proficiency
An SRE must be fluent in at least one high-level programming language (such as Go, Python, or Java) and shell scripting (Bash/Zsh). Unlike traditional sysadmins who might rely solely on configuration management tools like Ansible or Puppet, SREs write code to automate operations.
In the context of observability, this means writing custom exporters for Prometheus, creating instrumentation libraries for OpenTelemetry, or developing automated remediation scripts that trigger based on metric thresholds. Candidates should demonstrate the ability to write clean, testable, and maintainable code. A common mistake among juniors is writing “glue code” that works once but becomes unmaintainable at scale. Emphasize modularity and unit testing in your projects.
2. Understanding Distributed Tracing
Tracing is arguably the most powerful component of observability for debugging latency issues in microservices. Candidates must understand concepts such as spans, traces, context propagation, and sampling strategies.
You do not need to invent a tracing protocol, but you must understand how existing standards work. Familiarity with OpenTelemetry (OTel) can help candidates understand a widely adopted open-source approach to telemetry instrumentation. OTel provides vendor-neutral APIs and SDKs for instrumenting applications. An aspiring SRE should be able to explain how trace context is propagated across service boundaries via headers (e.g., W3C Trace Context) and how this data is aggregated to visualize the path of a request.
3. Metrics Aggregation and Analysis
Metrics provide numerical data over time. Understanding the difference between counters, gauges, histograms, and summaries is essential. More importantly, candidates must grasp the mathematical implications of aggregating these metrics. For instance, averaging latencies across thousands of requests can hide tail latency issues (the slowest 1% of requests), which often impact user experience more than the average.
Proficiency in query languages like PromQL (for Prometheus) or LogQL (for Loki) is expected. However, beyond syntax, employers look for an understanding of cardinality. High-cardinality labels (such as unique user IDs) can explode the size of a metrics database, leading to performance degradation. Knowing when not to add a label is a sign of maturity.
4. Log Structuring and Correlation
Logs are unstructured or semi-structured text records. In modern observability stacks, logs are increasingly structured (JSON format) to allow for efficient querying and correlation with traces and metrics.
Candidates should understand the concept of log levels (DEBUG, INFO, WARN, ERROR) and the importance of contextual logging. A log line that says “Error occurred” is useless. A log line that includes the trace ID, the service name, the specific function, and relevant parameters is actionable. The skill lies in designing logging schemas that balance verbosity with storage costs.
Portfolio Evidence: Building Credibility Without Experience
For students and graduates lacking formal employment history, the portfolio is the primary vehicle for proving competence. However, generic tutorials (“I deployed a Hello World app on Kubernetes”) are insufficient. Employers seek evidence of problem-solving in complex environments. Here are three project archetypes that demonstrate SRE readiness.
Project 1: The Instrumented Microservice Demo
Build a simple application consisting of three distinct services (e.g., Frontend, API Gateway, Backend Database). Do not just deploy them; instrument them.
- Implementation: Use OpenTelemetry SDKs to generate traces, metrics, and logs for each service. Ensure that a single user request generates a trace spanning all three services.
- Storage: Deploy a lightweight observability stack locally using Docker Compose. Include Prometheus for metrics, Jaeger or Tempo for traces, and Loki for logs.
- The Twist: Introduce artificial faults. Create a script that randomly injects latency into the Backend service or causes intermittent 500 errors in the API Gateway.
- Documentation: Write a case study showing how you identified the source of the fault using only the observability data. Show screenshots of the trace waterfall revealing the slow span. Explain how you correlated the error rate metric with the specific log entries.
This project demonstrates end-to-end understanding: instrumentation, collection, visualization, and analysis.
Project 2: Custom Exporter Development
Prometheus has many built-in exporters, but building one shows deeper engagement. Choose a niche application or a custom internal tool (simulated) and write a Prometheus exporter in Go or Python.
- Requirement: The exporter must expose metrics that reflect the health of the target system. For example, if you choose a message queue, expose metrics for queue depth, consumer lag, and throughput.
- Challenge: Implement proper handling of connection failures. If the target system is down, the exporter should report a clear status rather than crashing or returning stale data.
- Value: This proves you understand the mechanics of metric scraping, exposition formats, and the lifecycle of monitoring agents.
Project 3: Chaos Engineering Experiment
Chaos engineering is the practice of experimenting on a system to build confidence in its capability to withstand turbulent conditions in production.
- Setup: Deploy a resilient application on Kubernetes.
- Experiment: Use a tool like LitmusChaos or Gremlin (or write custom scripts) to kill pods, network partition services, or exhaust CPU resources.
- Analysis: Document the system’s behavior during the chaos event. Did the auto-scaling group react correctly? Did the circuit breaker open? How did the observability stack capture the incident?
- Outcome: Present a post-mortem template. Even if the experiment was simulated, the structure of the analysis—timeline, impact, root cause, action items—mirrors real-world SRE workflows.
Professional Development Routes
There is no single linear path to becoming an SRE, but certain trajectories are more effective than others.
Route A: The Developer Turnaround
Software developers often make excellent SREs because they understand the codebase intimately. Their challenge is shifting mindset from “feature delivery” to “system stability.” * Action: Volunteer to own the deployment pipeline for your current team. Learn how your code behaves under load. Study the infrastructure dependencies of your application. * Gap to Fill: Infrastructure-as-Code (Terraform/Pulumi) and networking fundamentals. Developers often underestimate the complexity of DNS, load balancing, and TLS termination.
Route B: The Sysadmin Evolution
System administrators have deep knowledge of operating systems and networks but may lack coding fluency. * Action: Start automating repetitive tasks using Python or Go. Move away from manual SSH sessions to declarative configurations. Learn Git workflows thoroughly. * Gap to Fill: Application-level understanding. Sysadmins often treat applications as black boxes. To become an SRE, you must learn to read application logs and understand business logic to troubleshoot effectively.
Route C: The Cloud Native Specialist
Individuals focused on AWS/Azure/GCP certifications have strong platform knowledge but may lack hands-on engineering rigor. * Action: Build things. Certifications prove you know what buttons exist; portfolios prove you can solve problems. Focus on multi-cloud portability and avoiding vendor lock-in in your designs. * Gap to Fill: Coding best practices and algorithmic efficiency. Cloud platforms abstract much of the underlying compute, but SREs must still optimize resource usage and cost.
Employer Expectations and Interview Dynamics
When interviewing for SRE roles, expect a mix of technical screening, behavioral assessment, and practical exercises.
The Incident Response Simulation
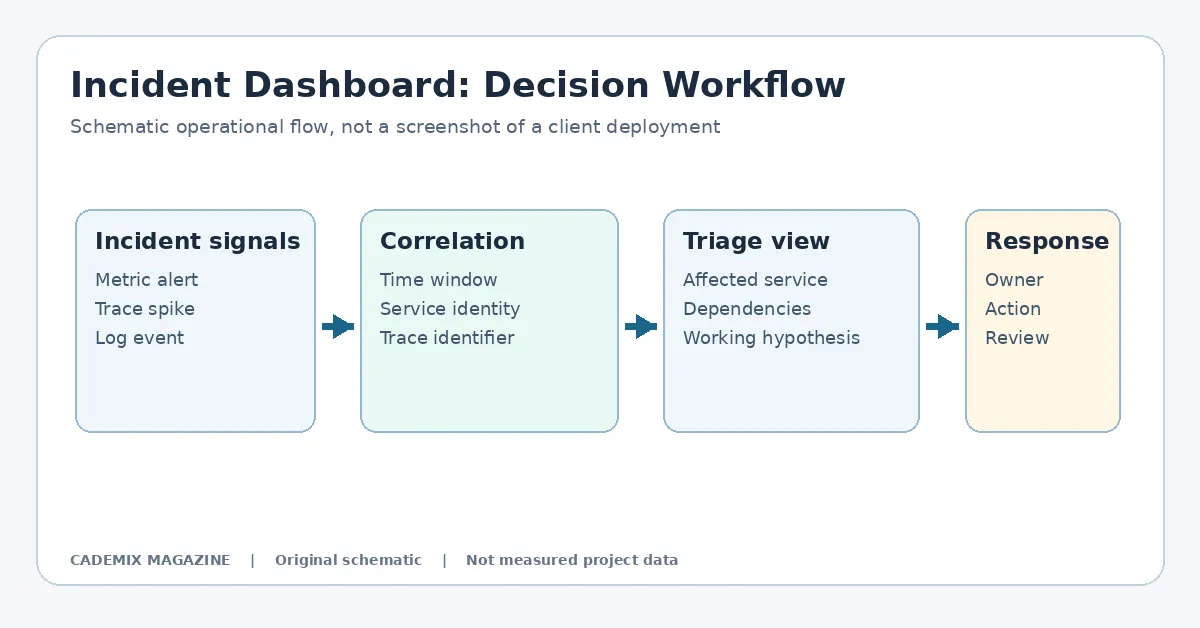
Many companies will present a hypothetical outage scenario. They may show you a dashboard with red alerts and ask, “What do you do?” * Expectation: They are not looking for the immediate fix. They are looking for your process. Do you check recent deployments? Do you look at traffic patterns? Do you communicate with stakeholders? * Key Trait: Calmness and systematic elimination. Avoid jumping to conclusions. Demonstrate how you would use observability tools to narrow down the scope of the issue.
Design Questions
You may be asked to design a monitoring strategy for a new service. * Expectation: Discuss Service Level Indicators (SLIs) and Service Level Objectives (SLOs). Don’t just list tools. Explain what you are measuring and why. For example, “We will measure latency at the 99th percentile because users perceive slowness in the tail, not the average.” * Key Trait: Business alignment. Connect technical metrics to user experience and business revenue.
Code Reviews
You might be asked to review a piece of infrastructure code or a script. * Expectation: Look for security vulnerabilities, idempotency (can the script run twice without breaking things?), and error handling. * Key Trait: Attention to detail and defensive programming.
Caveats and Common Pitfalls
As you pursue this career path, be aware of several traps that can hinder progress.
The Tooling Obsession
A common mistake among juniors is believing that learning every new observability tool makes them better. Tools change rapidly. Prometheus, Grafana, Datadog, New Relic, Splunk—the names matter less than the underlying concepts. Focus on understanding how data is collected, stored, and queried. If you understand the principles, switching tools is trivial. If you only memorize UI clicks, you are vulnerable to obsolescence.
Ignoring Cost Management
Observability data is expensive. Storing terabytes of logs and high-resolution metrics incurs significant cloud bills. Employers value SREs who understand the trade-off between visibility and cost. Be prepared to discuss sampling strategies, retention policies, and tiered storage solutions. Demonstrating awareness of FinOps (Financial Operations) is a strong differentiator.
Neglecting Soft Skills
SRE is a collaborative role. You will interact with product managers, developers, and executives. During incidents, you must communicate clearly and concisely. Blameless post-mortems require empathy and psychological safety. If you are technically brilliant but poor at communication or collaboration, you will struggle in an SRE environment. Practice writing clear documentation and explaining technical concepts to non-technical audiences.
Over-Reliance on Managed Services
While managed services (like AWS CloudWatch or Azure Monitor) are convenient, relying exclusively on them can limit your understanding of the underlying mechanics. Try to self-host a small observability stack at some point. Understand how Prometheus scrapes targets, how Jaeger handles distributed traces, and how Loki indexes log labels rather than full log contents. This foundational knowledge helps you troubleshoot the monitoring system itself, which is a frequent SRE task.
Conclusion
Becoming a Site Reliability Engineer is a journey of continuous learning, driven by the increasing complexity of distributed systems. The pathway is not defined by a specific degree or certification, but by a demonstrated ability to keep systems reliable through rigorous engineering practices.
Observability serves as the lens through which this reliability is achieved. By mastering the collection and analysis of logs, metrics, and traces, you gain the power to see inside the “black box” of modern infrastructure. For students and job seekers, the strategy is clear: build a portfolio that showcases not just deployment, but diagnosis. Write code that instruments systems. Design experiments that test resilience. Communicate findings with clarity.
Employers hiring for reliability roles commonly assess candidates’ ability to reduce mean time to recovery (MTTR) and improve system availability. They are not looking for passive observers; they are looking for active investigators. By positioning yourself as an expert in observability-driven reliability, you align your skills with the most pressing needs of the industry. The path is demanding, requiring both technical depth and operational wisdom, but for those who commit to it, the rewards—in impact, compensation, and career longevity—are substantial.
External reference for further study
Technical documentation and web-platform implementation background. See MDN Web Docs. This reference is a starting point, not a citation validating every claim in this article.
Reproducible SRE Portfolio Exercise
An SRE candidate can demonstrate reliability skills without claiming experience operating a production platform. Set up a small locally controlled service, instrument a request path and deliberately introduce a recoverable failure. Record the initial symptom, the metric or trace that prompted investigation and the steps used to test alternative explanations. A real portfolio should contain configuration excerpts, a runbook, a reproducible test and a short discussion of what cannot be inferred from the available telemetry.
Prepare a lightweight incident review that distinguishes detection, diagnosis and response. A candidate should explain why a chosen alert threshold is useful, which false positives might occur and what escalation path would apply if the first response failed. Describe safe rollback and how an engineer would communicate uncertain information to a colleague or customer. Avoid making broad claims that a particular tool automatically improves availability or that a single simulated incident proves competence under production conditions.
For an evidence-based learning path, compare terminology with the Google Site Reliability Engineering book and the OpenTelemetry observability primer. This material can support technical understanding, but employment requirements vary by organization and role. The portfolio should describe demonstrated tasks accurately, keep secrets out of screenshots and distinguish a controlled demonstration from a live incident response.