
From Concept to Practice: A Practical Incident Dashboard for Observability in Distributed Systems
Editorial Identifier: CM-0023 Category: Software Engineering & DevOps Angle: Industry Methods & Case Study
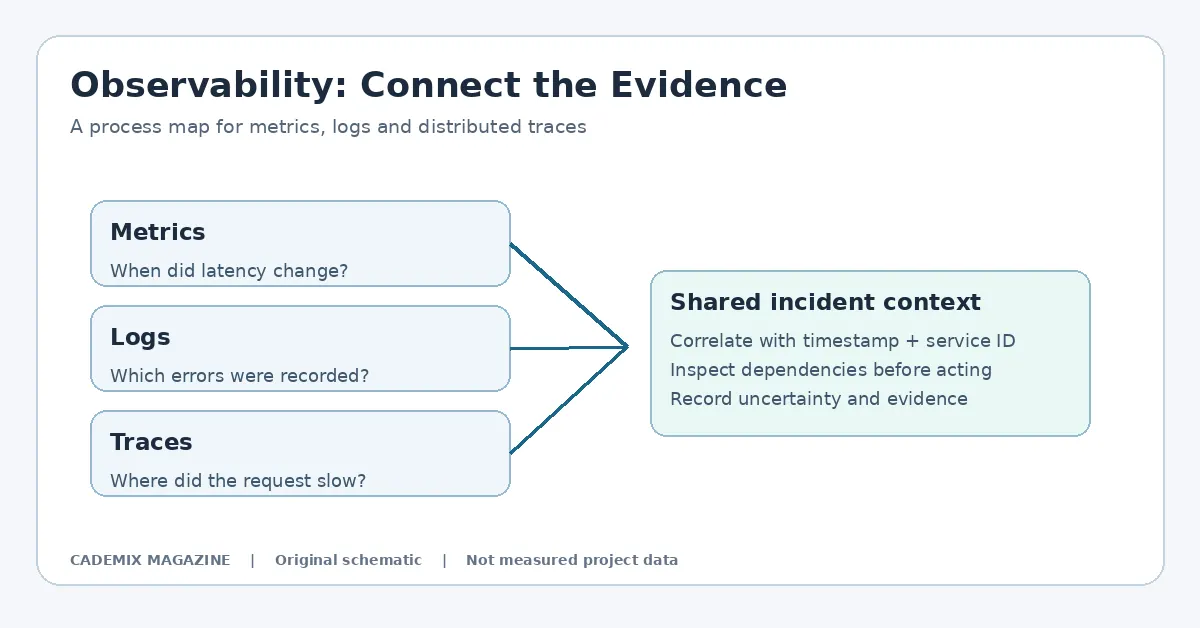
Table of Contents
Table of Contents
- The Problem with Generic Monitoring
- Defining the Scope: Inputs and Requirements
- Proposed Methodology: The "Contextual Overlay" Approach
- Layer 1: Data Aggregation and Correlation
- Layer 2: Dynamic Query Generation
- Layer 3: Visualization Interface
- Implementation Details and Tool Selection
- Backend Logic
- Frontend Design Patterns
- Testing Strategy: Validating Utility Under Pressure
- Synthetic Chaos Engineering
- User Acceptance Testing (UAT) with Engineers
- Cost Analysis and Resource Implications
- Risks and Caveats
- Measurable Results and Expected Outcomes
- Conclusion
- Further reading: Practical Incident Dashboard For Observability
- External reference for further study
In the modern landscape of distributed computing, the gap between data collection and actionable insight remains one of the most persistent challenges for engineering teams. Organizations invest heavily in observability stacks—gathering metrics, logs, and traces from microservices architectures—yet often find themselves paralyzed during critical incidents. The sheer volume of telemetry can obscure root causes, leading to prolonged Mean Time To Resolution (MTTR) and increased operational stress. This article explores the conceptualization and practical implementation of a dedicated incident dashboard, moving beyond generic monitoring views to create a focused, high-signal interface designed specifically for the chaos of production outages.
The Problem with Generic Monitoring
Traditional monitoring dashboards are typically built for steady-state operations. They display aggregate trends over days or weeks, optimized for capacity planning and long-term performance analysis. While useful for routine health checks, these interfaces fail under pressure. When an alert fires at 3:00 AM, an engineer does not need to see the average CPU utilization of the last month; they need to know what changed in the last ten minutes, which service is failing, and where the bottleneck lies.
The core issue is signal-to-noise ratio. In a distributed system comprising dozens or hundreds of services, a single failure can cascade, triggering alerts across multiple layers. Without a curated view that correlates these events, engineers must manually piece together context from disparate tools. This cognitive load leads to decision fatigue and errors. An effective incident dashboard must therefore be distinct from operational dashboards. It should be ephemeral, contextual, and aggressively filtered to show only the data relevant to the active problem.
Defining the Scope: Inputs and Requirements
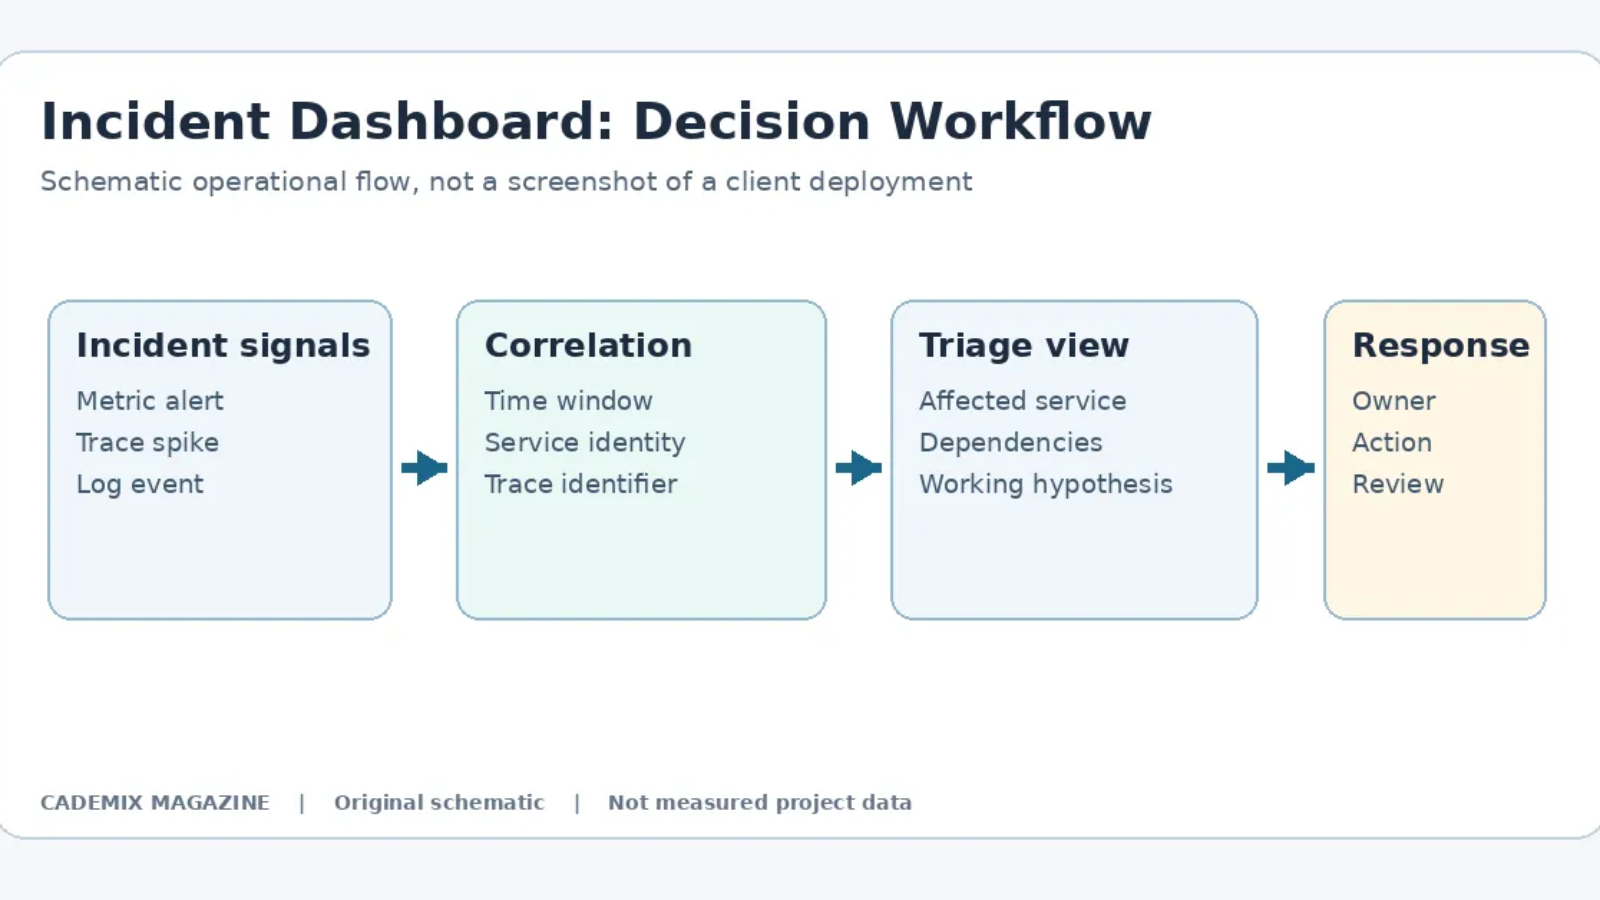
Before selecting tools, we must define the inputs required for a functional incident dashboard. Unlike standard monitoring, which relies on pre-defined static queries, an incident dashboard requires dynamic context injection. The primary inputs include:
- Active Alert Metadata: The specific trigger event, including severity level, affected service identifiers, and timestamp of initiation.
- Correlated Telemetry: Metrics, logs, and traces that share temporal proximity with the alert.
- Change History: Recent deployments, configuration changes, or feature flag toggles within the affected window.
- Dependency Graphs: Real-time topology showing upstream and downstream dependencies of the failing component.
The requirement is not just to display this data, but to present it in a way that allows rapid hypothesis testing. For example, if Service A is timing out, the dashboard should immediately highlight whether Service B (its dependency) is also degraded, or if the issue is isolated to Service A’s internal logic.
Proposed Methodology: The “Contextual Overlay” Approach
We propose a methodology termed the “Contextual Overlay.” Rather than building a monolithic new application, this approach leverages existing observability platforms to create a specialized view that activates only during incident states. The architecture consists of three layers:
Layer 1: Data Aggregation and Correlation
This layer sits between the raw telemetry sources and the visualization engine. Using a stream-processing framework (such as Apache Flink or Kafka Streams), incoming metrics and logs are tagged with incident IDs when an alert threshold is breached. This tagging allows for quick retrieval of all data points associated with a specific outage window. Crucially, this layer performs basic correlation, linking trace IDs from failed requests to their corresponding log entries and metric spikes.
Layer 2: Dynamic Query Generation
Standard dashboards use static PromQL or SQL queries. The Contextual Overlay uses templated queries that inject variables based on the incident metadata. If an alert identifies service=payment-gateway and region=us-east, the query generator constructs filters targeting only those dimensions. This prevents the dashboard from rendering irrelevant data from other regions or services, significantly reducing load times and visual clutter.
Layer 3: Visualization Interface
The front-end is a lightweight web interface embedded within the incident management tool (e.g., PagerDuty, Opsgenie, or a custom Slack bot). It renders charts using libraries like D3.js or Chart.js, focusing on time-series alignment. The key design principle here is “temporal anchoring.” All graphs are aligned to the moment the alert fired, allowing engineers to instantly see what happened before, during, and after the trigger.
Implementation Details and Tool Selection
For this case study, we assume a typical cloud-native stack: Kubernetes for orchestration, Prometheus for metrics, Loki for logs, and Tempo for traces. The implementation focuses on integrating these components into a cohesive incident view.
Backend Logic
The backend service listens for webhook events from the alerting manager. Upon receiving an alert, it spawns a temporary session object containing the incident ID and scope parameters. It then queries the observability APIs to fetch the last 15 minutes of data for the specified scope. Instead of storing this data permanently, it caches it in memory or a fast-access store like Redis for the duration of the incident. This ensures that the dashboard loads quickly without hammering the underlying storage systems with heavy analytical queries.
A critical technical detail is handling cardinality. High-cardinality labels (like user IDs or request IDs) can explode the size of the dataset. The implementation must apply downsampling strategies for metrics while retaining full granularity for logs and traces related to error rates. We recommend using exponential histograms for latency metrics to maintain accuracy at lower storage costs.
Frontend Design Patterns
The UI should follow a “triage-first” layout. The top section displays the “Golden Signals” (Latency, Traffic, Errors, Saturation) for the affected service. Below this, a split-pane view shows correlated logs on the left and trace waterfalls on the right. When an engineer clicks on a spike in the error rate chart, the log pane automatically filters to show only error-level logs from that exact second. Similarly, clicking a slow span in the trace waterfall highlights the corresponding database query logs.
Interactivity is paramount. Static images do not help during debugging. The dashboard must support zooming, panning, and cross-filtering. However, complexity must be managed. Too many controls overwhelm users. We suggest limiting interactive elements to essential actions: drill-down, compare time ranges, and export snapshot.
Testing Strategy: Validating Utility Under Pressure
Testing an incident dashboard differs significantly from testing standard software. Functional correctness is necessary but insufficient. The primary metric for success is usability during simulated crises.
Synthetic Chaos Engineering
We employ chaos engineering principles to generate realistic incident scenarios. Tools like LitmusChaos or Gremlin can inject faults such as network latency, pod evictions, or resource exhaustion. During these experiments, the dashboard must accurately reflect the injected fault without false positives. For instance, if network latency is introduced between two services, the dashboard should clearly visualize the increase in round-trip time (RTT) in the trace view and correlate it with timeout errors in the logs.
User Acceptance Testing (UAT) with Engineers
Recruiting actual Site Reliability Engineers (SREs) for UAT is crucial. We present them with recorded incident replays and ask them to identify the root cause using only the dashboard. Success criteria include: * Time to Insight: How long until the engineer forms a correct hypothesis? * False Lead Rate: How often does the dashboard mislead the engineer toward an incorrect conclusion? * Cognitive Load: Subjective rating of mental effort required to interpret the data.
If engineers spend more time navigating the dashboard than analyzing the data, the design has failed. Iterative refinement based on feedback loops is essential. For example, early versions might have shown too many unrelated metrics, causing distraction. Subsequent iterations reduced visibility by default, requiring explicit expansion for secondary data.
Cost Analysis and Resource Implications
Building and maintaining a specialized incident dashboard incurs both direct and indirect costs. Direct costs include infrastructure for the aggregation layer (compute instances for stream processing) and storage for cached incident data. Indirect costs involve development time and ongoing maintenance as the underlying observability stack evolves.
However, the cost-benefit analysis must consider the value of reduced MTTR. Even a minor improvement in resolution time translates to significant savings in lost revenue, customer trust, and engineering overtime. Furthermore, by optimizing queries to target only relevant scopes, the dashboard can actually reduce overall load on the observability backend compared to broad, unfiltered queries run by multiple engineers simultaneously.
It is important to note that this solution is not free. High-fidelity correlation requires robust indexing and potentially higher-tier storage classes for hot data. Organizations must budget for these resources explicitly rather than assuming they fit within existing monitoring quotas.
Risks and Caveats
No system is without risk. The Contextual Overlay approach introduces several potential pitfalls:
- Stale Data: If the correlation layer lags behind real-time ingestion, the dashboard may show incomplete pictures. This can lead to premature conclusions. Mitigation involves displaying data freshness indicators prominently on the UI.
- Over-Correlation: Automated correlation algorithms might link unrelated events simply because they occurred close in time. This creates noise. Human-in-the-loop verification remains necessary; the dashboard should suggest correlations, not assert causality.
- Vendor Lock-in: Relying on proprietary features of specific observability vendors can make migration difficult. Where possible, use open standards (OpenTelemetry) for data collection to ensure portability.
- Security Exposure: Incident dashboards often expose sensitive internal details. Access controls must be strict, ensuring that only authorized personnel can view detailed logs and traces during an incident. Audit logging of dashboard access is recommended for compliance.
Measurable Results and Expected Outcomes
The effectiveness of an incident dashboard should be evaluated against defined operational metrics. The possible outcomes below are hypotheses to test, not measured results from a deployed client system.
- Reduced MTTR: By providing immediate context, engineers spend less time gathering data and more time fixing issues. Any reduction in MTTR should be established through a controlled comparison of incident response performance before and after deployment; no universal percentage improvement can be assumed.
- Improved On-Call Experience: Clearer data reduces anxiety and burnout among on-call engineers. Knowing that the necessary information is readily available fosters confidence and faster response times.
- Enhanced Post-Incident Reviews: Accurate, consolidated timelines generated by the dashboard serve as valuable artifacts for blameless post-mortems, improving the quality of learning from failures.
These benefits are contingent on the dashboard being trusted by the engineering team. If the tool frequently provides misleading or incomplete data, adoption will drop, and engineers will revert to manual methods. Trust is built through consistency and transparency about data limitations.
Conclusion
The transition from concept to practice in observability requires shifting focus from data accumulation to data utility. A practical incident dashboard is not merely a collection of charts; it is a cognitive aid designed to accelerate human decision-making during crises. By implementing a Contextual Overlay approach—aggregating correlated telemetry, dynamically generating scoped queries, and presenting temporally anchored visualizations—organizations can bridge the gap between raw signals and actionable insights.
This method demands careful attention to engineering details, rigorous testing under simulated chaos, and honest acknowledgment of its limitations and costs. The proposed workflow could improve incident analysis, but any effect on resolution time or operational cost must be tested against real deployment data. In distributed systems, where complexity is inevitable, clarity is the ultimate competitive advantage. Building tools that deliver that clarity during the darkest moments of an outage is not just a technical task; it is an operational imperative.
External reference for further study
Technical documentation and web-platform implementation background. See MDN Web Docs. This reference is a starting point, not a citation validating every claim in this article.
Incident Dashboard: Evidence and Verification Checklist
An incident dashboard should help an engineer decide what to investigate next, not claim to identify the root cause automatically. Begin with the observed symptom and its time window. Show service identity, deployment version, relevant metrics, examples of application errors and distributed trace links. If several components changed together, record that uncertainty explicitly. Correlation across timestamps does not establish causation. A dashboard that presents one suspected service as the proven root cause can delay diagnosis when the actual fault is elsewhere.
For an illustrative implementation, use synthetic application requests and deliberately introduced test failures rather than production customer data. Configure a small service to record request identifiers, service names and stable time fields. Generate a controlled burst of requests, then simulate a slow downstream dependency. Check whether the dashboard helps a reviewer move from an alert to the relevant trace and error record without relying on unexplained labels. Document the setup clearly so another engineer can repeat the exercise and determine whether the proposed workflow actually works.
Preserve data provenance. Every chart should identify its metric, aggregation rule and time interval. Logs may contain personal information or credentials and should be filtered and access-controlled before being shared. Trace sampling can omit rare requests, so absence of a trace is not definitive evidence that an event did not occur. A reliable incident interface exposes these limitations rather than hiding them behind polished visuals. Retain enough information to revisit a decision during a post-incident review, without creating unnecessary long-term storage of sensitive data.
Measures to Test in an Operational Pilot
To evaluate a real deployment, define the incident types and compare workflow performance with a documented baseline. Possible measures include time to locate a relevant trace, time to identify the affected dependency, number of navigation steps and reviewer confidence in the supporting evidence. Do not assume the dashboard reduces incident duration: differences in severity, team experience and infrastructure can explain an apparent change. Use a small controlled exercise before making a stronger business case, and report what was not tested.
Review the OpenTelemetry observability concepts for terminology and telemetry context, and the Prometheus documentation for metrics collection concepts. These technical resources do not validate performance claims about this illustrative Cademix dashboard.
Document the Limits of Incident Dashboard Evidence
Even a carefully designed incident dashboard can display incomplete or delayed information. A signal may arrive after the incident began, and a sampled trace may omit a critical request. Always document the difference between observed telemetry, a working hypothesis and an independently confirmed explanation. When preparing a client demonstration, use synthetic workloads with plainly labeled test data; never present simulated response-time improvements as a verified production outcome. Define how the test environment differs from deployment conditions and which additional checks would be necessary before making reliability claims.
Incident Review: Keep Conclusions Traceable
The dashboard should preserve a short evidence trail for every important decision. If an engineer suspects a database dependency, note the relevant service identifiers, time window and trace references before making a change. A later reviewer must be able to distinguish the initial observation, alternative hypotheses and the reason one response was selected. Avoid overwriting early hypotheses after the incident because this can make a final explanation appear more certain than the evidence actually was.
Operational metrics have limits. A sampled request trace cannot represent every user experience; average latency may conceal a small group of slow requests; and synchronized dashboards may still receive data at different delays. During validation, deliberately test missing telemetry, clock differences, access restrictions and ambiguous alerts. A robust incident dashboard should explain missing data and give the engineer a way to inspect underlying records safely rather than presenting an empty graph as proof that nothing happened.
Document the version of the dashboard, which data sources were connected and which parts of the scenario were simulated. This makes the example useful as a technical portfolio artifact and avoids suggesting a Cademix client deployment was completed. Real operational benefits should be evaluated only when a service team can collect comparable incident records and test the workflow under appropriate governance.